These plot methods plot goodness of fit objects created using
RSiena::sienaGOF(), MoNAn::monanGOF(), or the 'ergm' package's gof() function.
Internally, the GOF object is translated into a common class (ag_gof),
which has its own plot method to ensure a consistent look and feel.
It is not expected that users will create ag_gof class objects themselves.
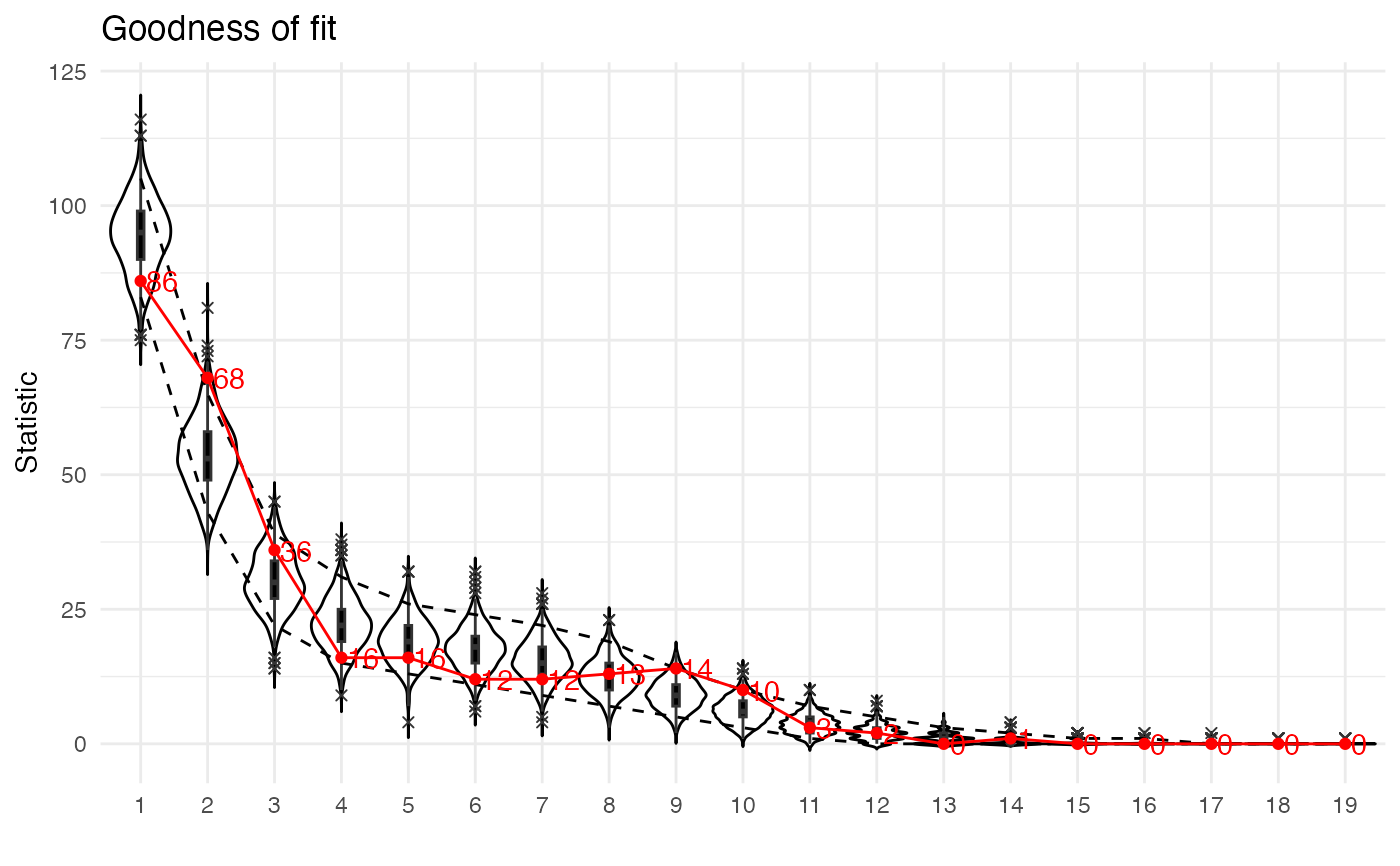
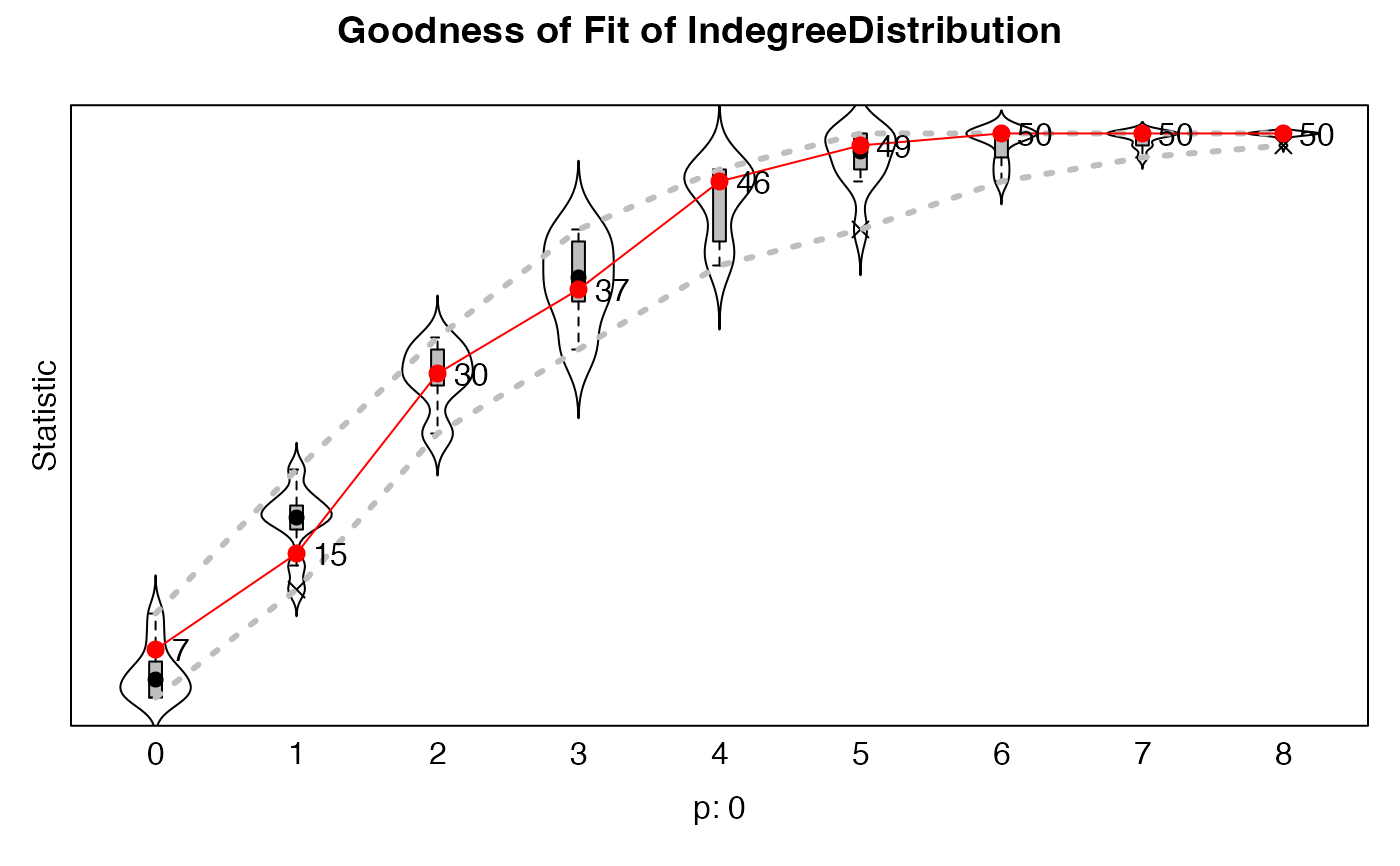
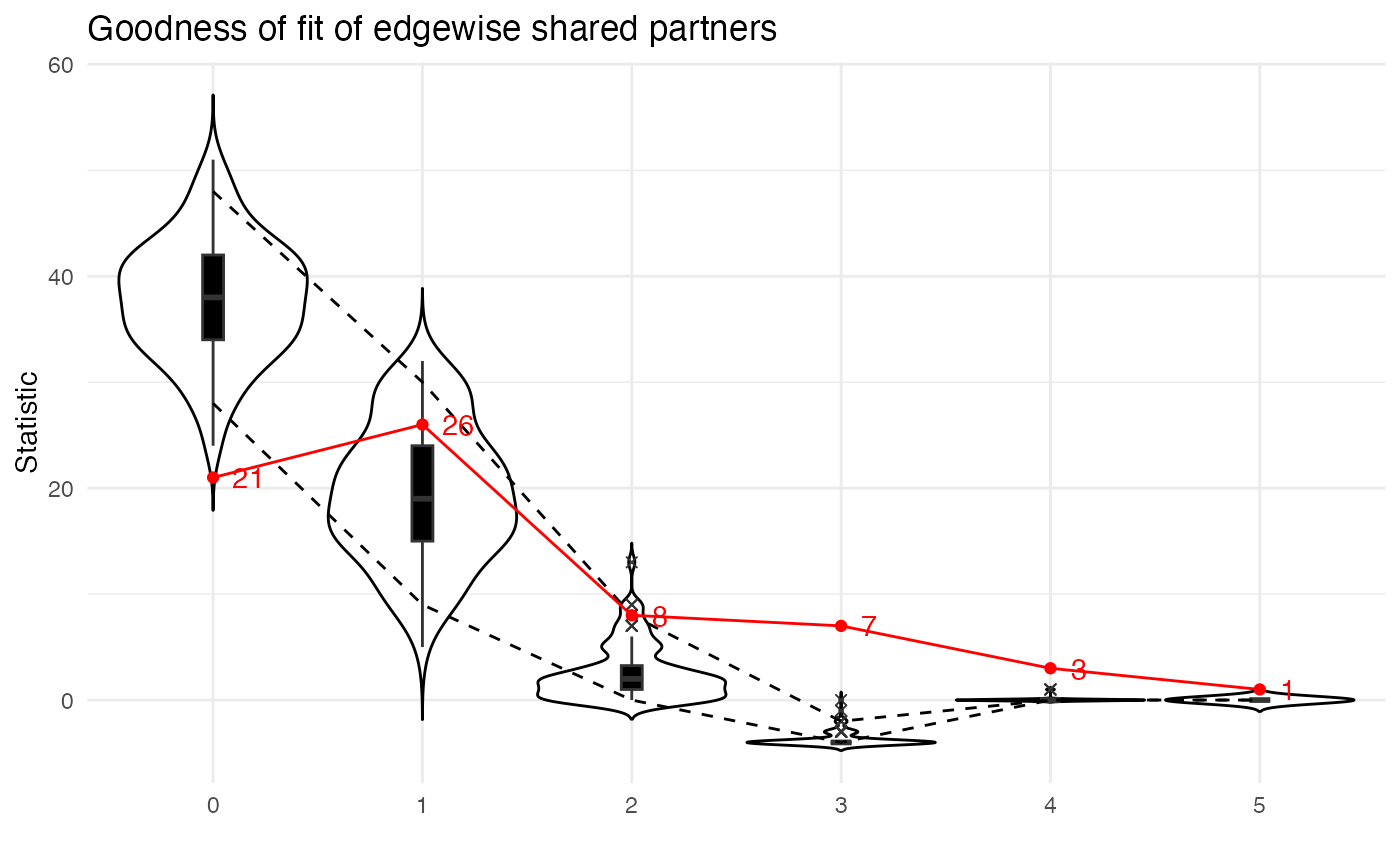
The plot shows a violin plot of the distribution of statistics from the
simulations, with a boxplot inside the violin to show the interquartile range,
and dashed lines connecting the 5th and 95th percentiles.
The boxplot also shows outliers as crosses.
The observed statistics are shown as points and connected by a line.
The observed statistics are also labelled with their value.
If a p-value is available (as in the case of RSiena::sienaGOF()),
it is shown beneath the x-axis.
Usage
# S3 method for class 'ag_gof'
plot(x, ...)

# S3 method for class 'gof.stats.monan'
plot(x, cumulative = FALSE, ...)

# S3 method for class 'sienaGOF'
plot(x, cumulative = FALSE, ...)

# S3 method for class 'gof.ergm'
plot(
  x,
  cumulative = FALSE,
  statistic = c("degree", "odegree", "idegree", "b1degree", "b2degree", "espartners",
    "dspartners", "distance"),
  ...
)
Arguments
- x
An object of class "sienaGOF", "gof.stats.monan", or "gof.ergm".
- ...
Other parameters to be passed to the plotting function, for example
main = "Title"for a different title than the default.- cumulative
Logical, indicating whether the statistics should be plotted cumulatively (default FALSE). This is typically treated in
sienaGOF()for{RSiena}, but treated within the plotting function for{MoNAn}and 'ergm'.- statistic
Character, indicating which statistic to plot. Since 'ergm' package GOFs include goodness of fit on multiple statistics, the user must specify which statistic to plot. Options are
"deg"(degree distribution),"espart"(edgewise shared partners), and"dist"(geodesic distance). The default is"deg".
Value
A violin plot showing the distribution of statistics from the simulations and a line joining points showing the observed statistics.
Details
Since these plots methods are in {autograph},
the plots are automatically themed according to the current theme
set using stocnet_theme().
The function uses the highlight colour defined in the current theme
to highlight the observed statistics.
The function also uses the base colour defined in the current theme
to draw the violin and box plots.
It is however completely customisable.
While a title is automatically generated so that the graph is informative,
this can be customised by specifying the main argument in the plotting function,
or added after the fact using {ggplot2} functions such as
ggtitle() or labs().
The user can choose whether to plot the statistics cumulatively or not.
This is typically handled within RSiena::sienaGOF(),
but for MoNAn::monanGOF() and the 'ergm' package's gof() function
the cumulative option is handled here.
The default is to plot the non-cumulative statistics.
This is because the non-cumulative statistics are often more interpretable,
and the cumulative statistics can be obtained by setting cumulative = TRUE.
The function also checks whether any of the statistics have zero variance across the simulations, and if so, these statistics are not plotted, with a message to the user indicating which statistics were omitted.
Note that these methods overwrite any plot methods for these classes
that may be provided by the original packages.
You may receive such a warning in the console when loading the package.
Please load {autograph} after these other packages to ensure the plotting
methods included in this package are used,
or specify the package when calling the plotting method directly,
e.g., autograph:::plot.sienaGOF(res_siena_gof).
References
Hintze, J. L. and Nelson, R. D. 1998. "Violin plots: A box plot-density trace synergism". The American Statistician, 52:181–184. doi:10.1080/00031305.1998.10480559