These functions support the interpretation of network and behavior effects
found in stochastic actor-oriented models.
They are S3 plotting methods for objects of class "selectionTable"
or "influenceTable", created using RSiena::selectionTable()
or RSiena::influenceTable(), respectively.
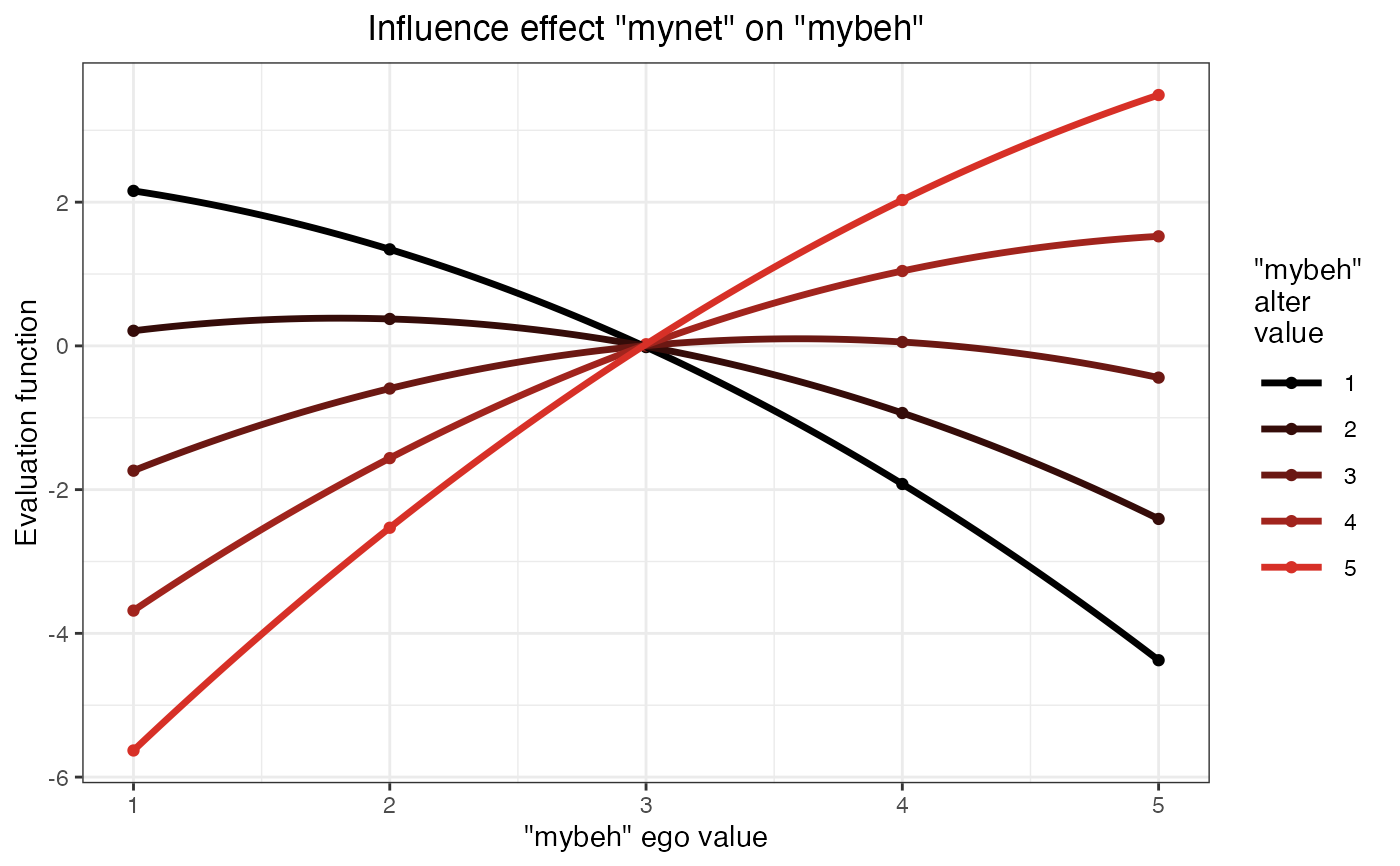
They plot how the evaluation function for selection or influence
changes based on ego's value and alter's value of some covariate.
This helps to interpret the effect of that covariate on the network dynamics
or behavior dynamics, respectively.
Arguments
- x
An object of class "selectionTable" or "influenceTable", created using
RSiena::selectionTable()orRSiena::influenceTable(), respectively.- quad
When TRUE (the default), a quadratic function (average and total alter) is plotted. Use
quad = FALSEfor similarity effects.- separation
This can be used to make the curves visually distinguishable if they overlap too much without it. An advisable value then is, e.g., 0.01.
- ...
Other arguments to be passed.
Value
A plot showing how the selection/influence evaluation function changes based on ego's value and alter's value of some covariate.
Details
These functions were originally written by Tom Snijders, and adapted
for use in the {autograph} package.
References
For plotting selection tables, please consult the RSiena manual, Sections 13.1 and 13.3.
For plotting selection tables, please consult the RSiena manual, Sections 13.2 and 13.4.
See also
Other RSiena:
plot_gof
Examples
plot(siena_selection)
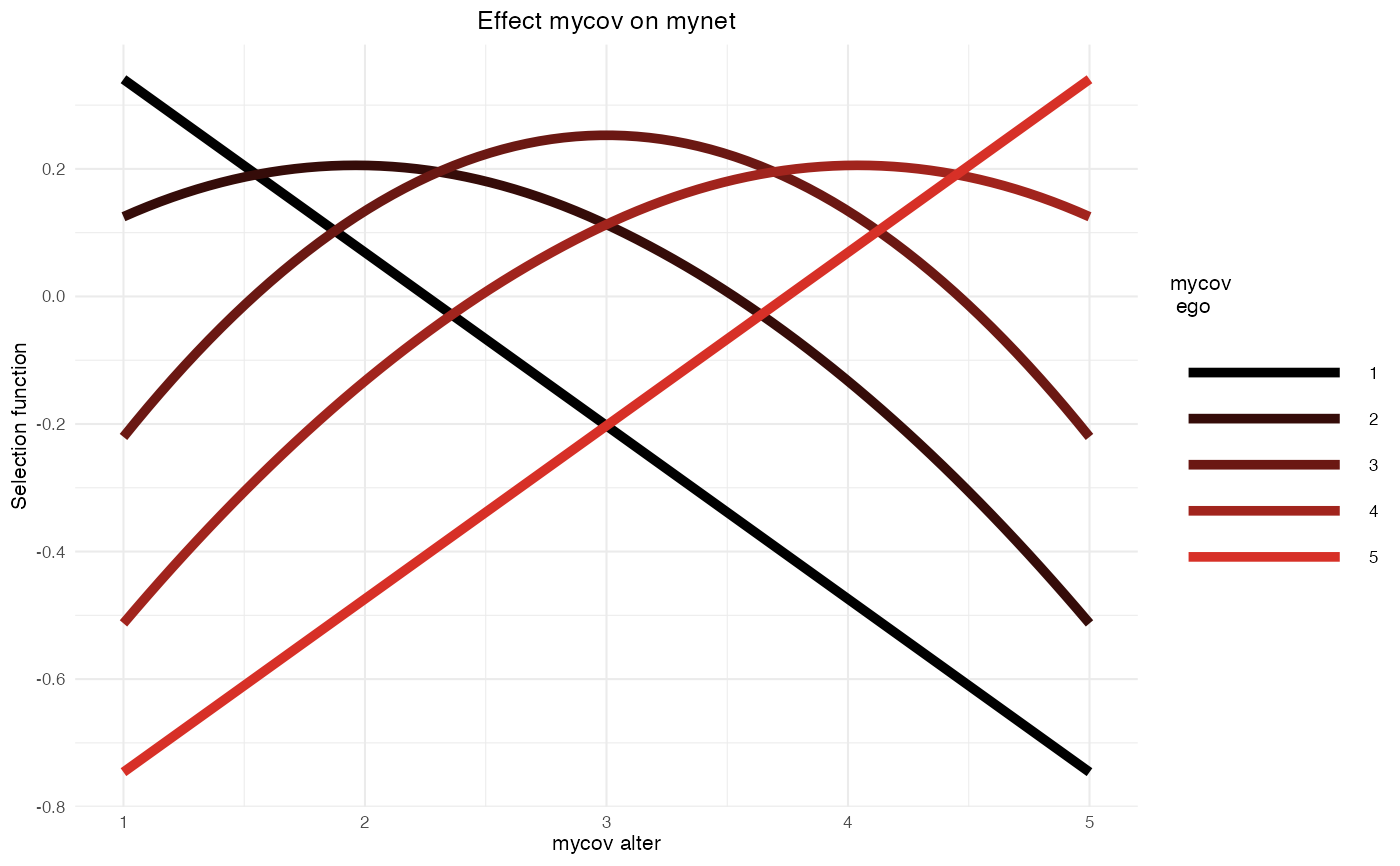 plot(siena_selection) + ggplot2::scale_colour_discrete()
#> Scale for colour is already present.
#> Adding another scale for colour, which will replace the existing scale.
plot(siena_selection) + ggplot2::scale_colour_discrete()
#> Scale for colour is already present.
#> Adding another scale for colour, which will replace the existing scale.
 plot(siena_influence)