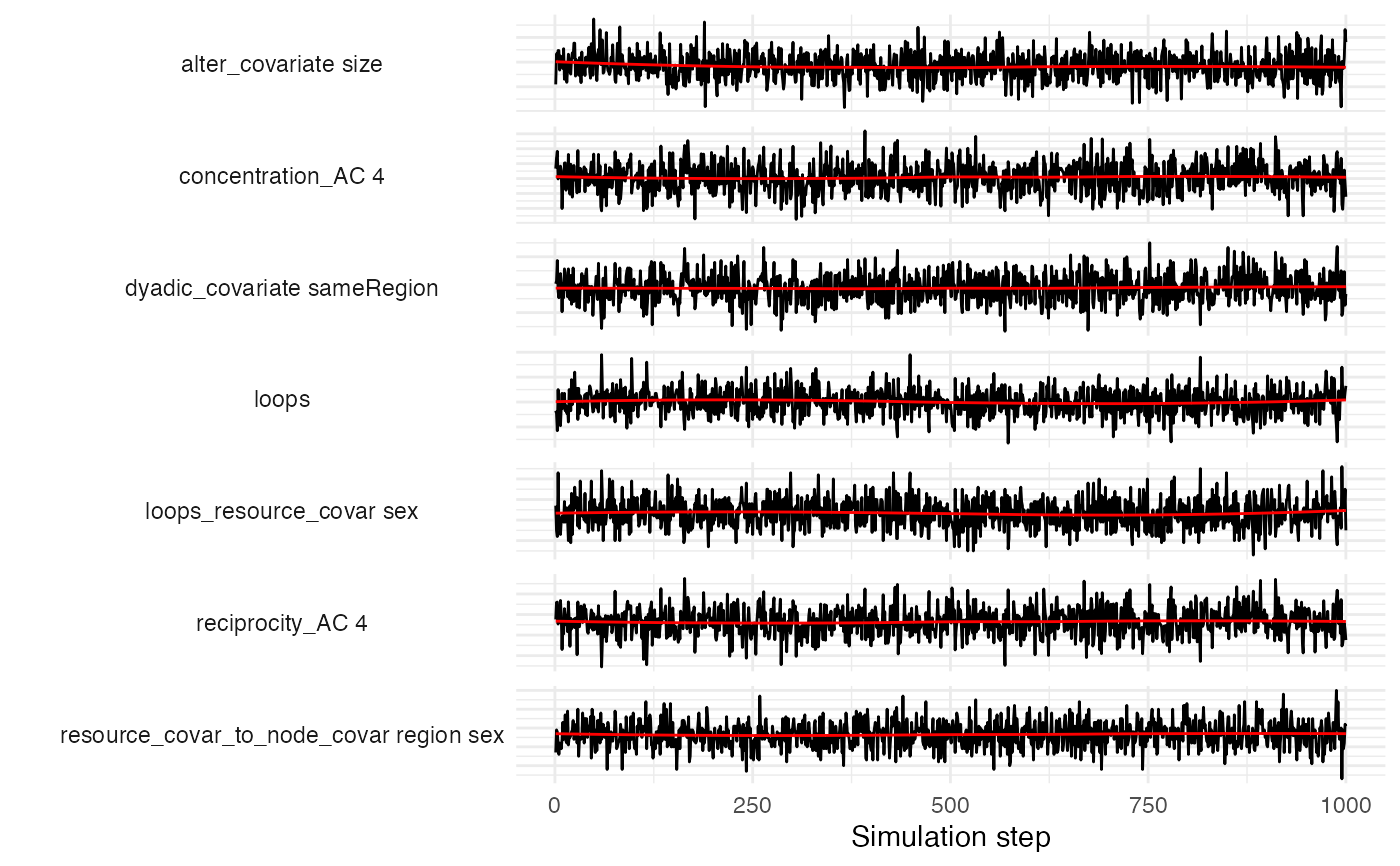
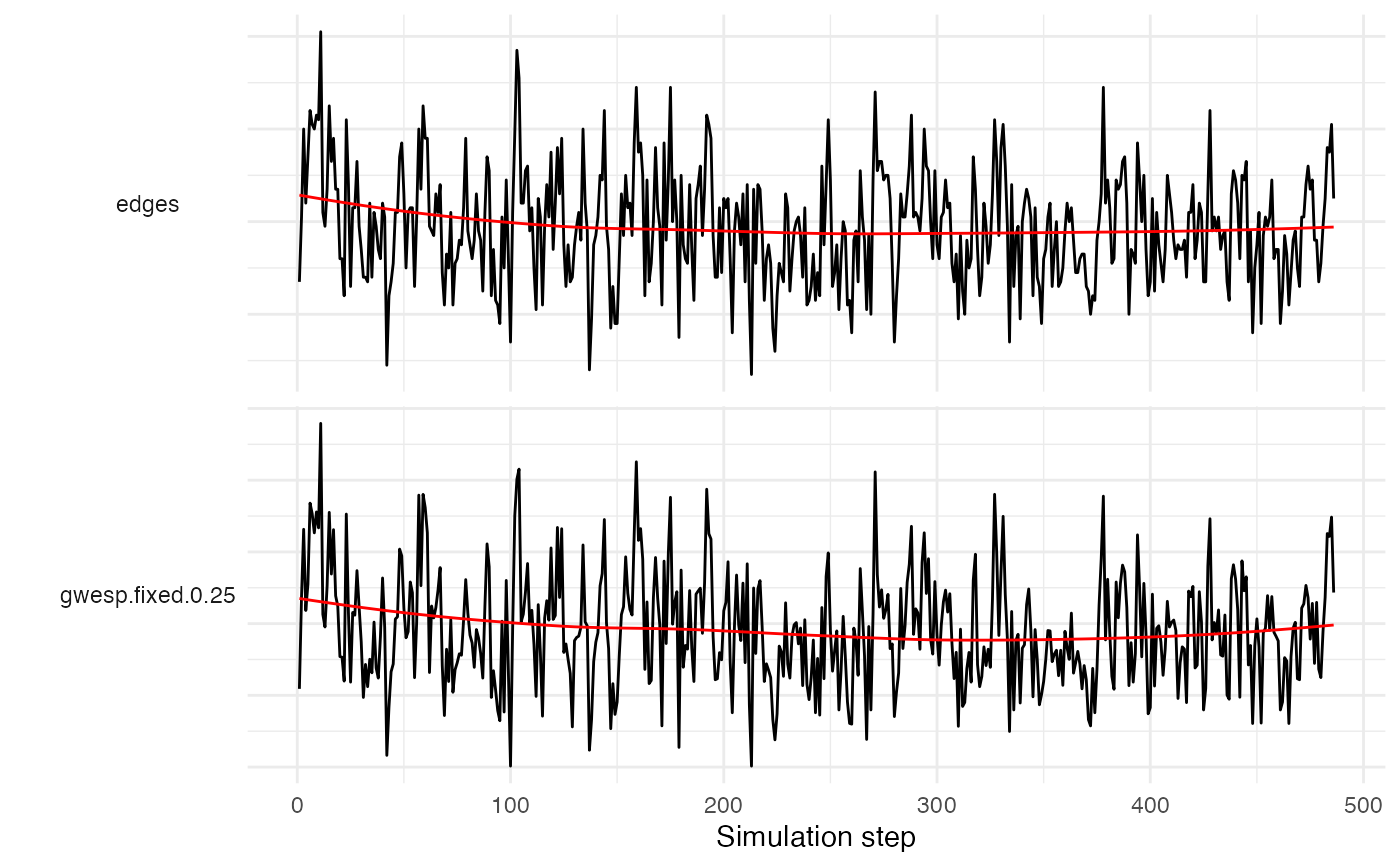
These plotting methods are for diagnosing the convergence of
simulation-based estimation procedures, such as those used in
MoNAn and ergm.
These plots are useful for identifying whether the estimation procedure
has adequately explored the state space and converged to a stable
distribution.
Usage
# S3 method for class 'ag_conv'
plot(x, ...)

# S3 method for class 'traces.monan'
plot(x, ...)

# S3 method for class 'ergm'
plot(x, ...)
Arguments
- x
An object of class "traces.monan".
- ...
Additional plotting parameters, currently unused.
Value
The function shows a line plot tracing the statistics obtained at
each simulation step, as well as a density plot showing the distribution
of the statistics over the entire simulation.


