Plotting opinion models
Arguments
- x
An 'opinionModel', as from
manynet::as_opinion().- ...
Other arguments to be passed.
- stubbornness
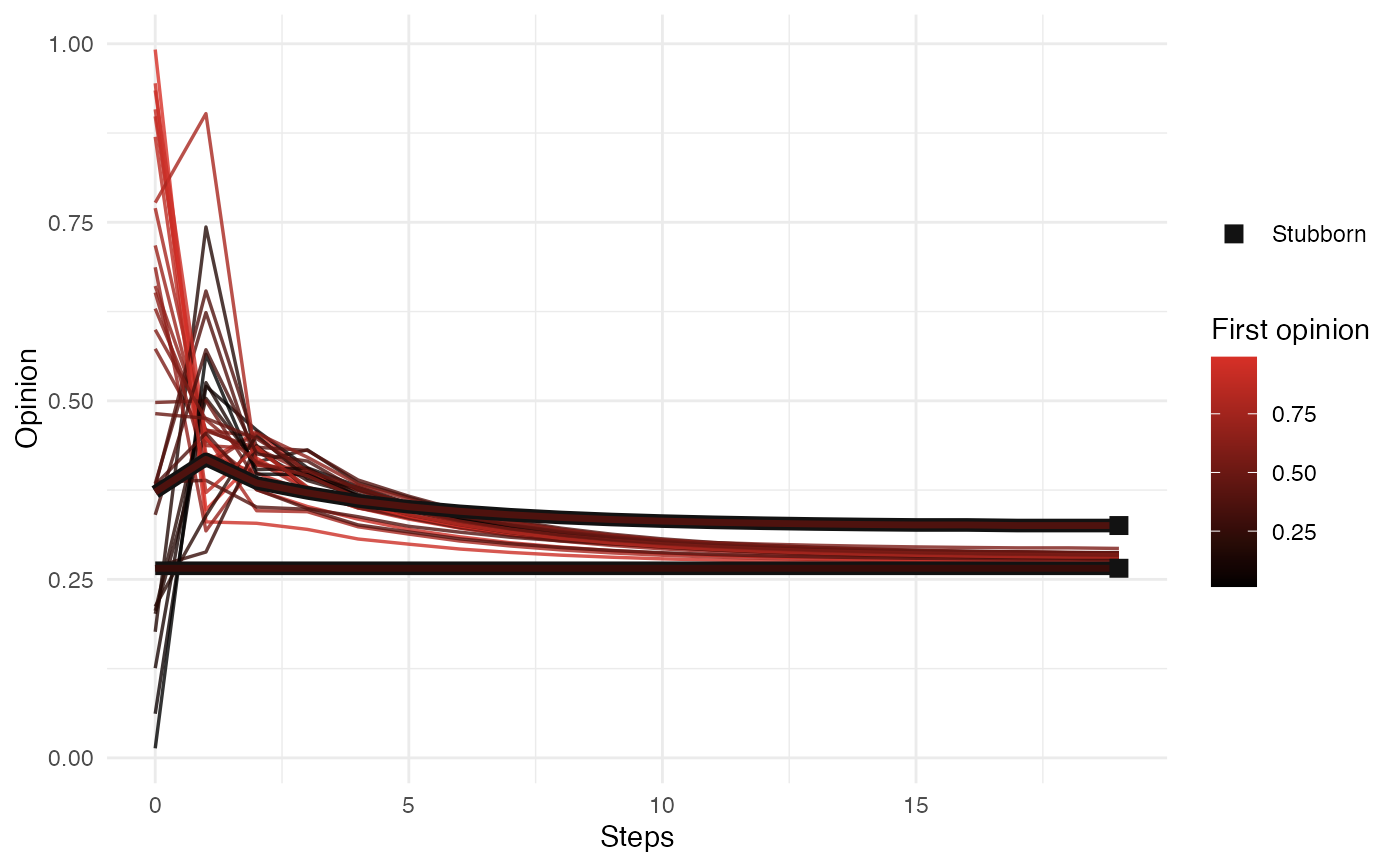
Optionally, the stubbornness of each node, as one number or one number for each node, from 0 to 1. The nodes with a stubbornness above 0 are drawn with a thicker line, and a square at the last step. By default
NULL, which marks no node.- outcome
For
plot.opinionSweep(), the measure of the opinions at the end to draw:"clusters"(the default),"consensus"(the share of the runs that reach one),"spread","mean", or"steps".- level
For
plot.opinionSweep(), the share of the runs that the band holds for each setting. By default 0.95.
Value
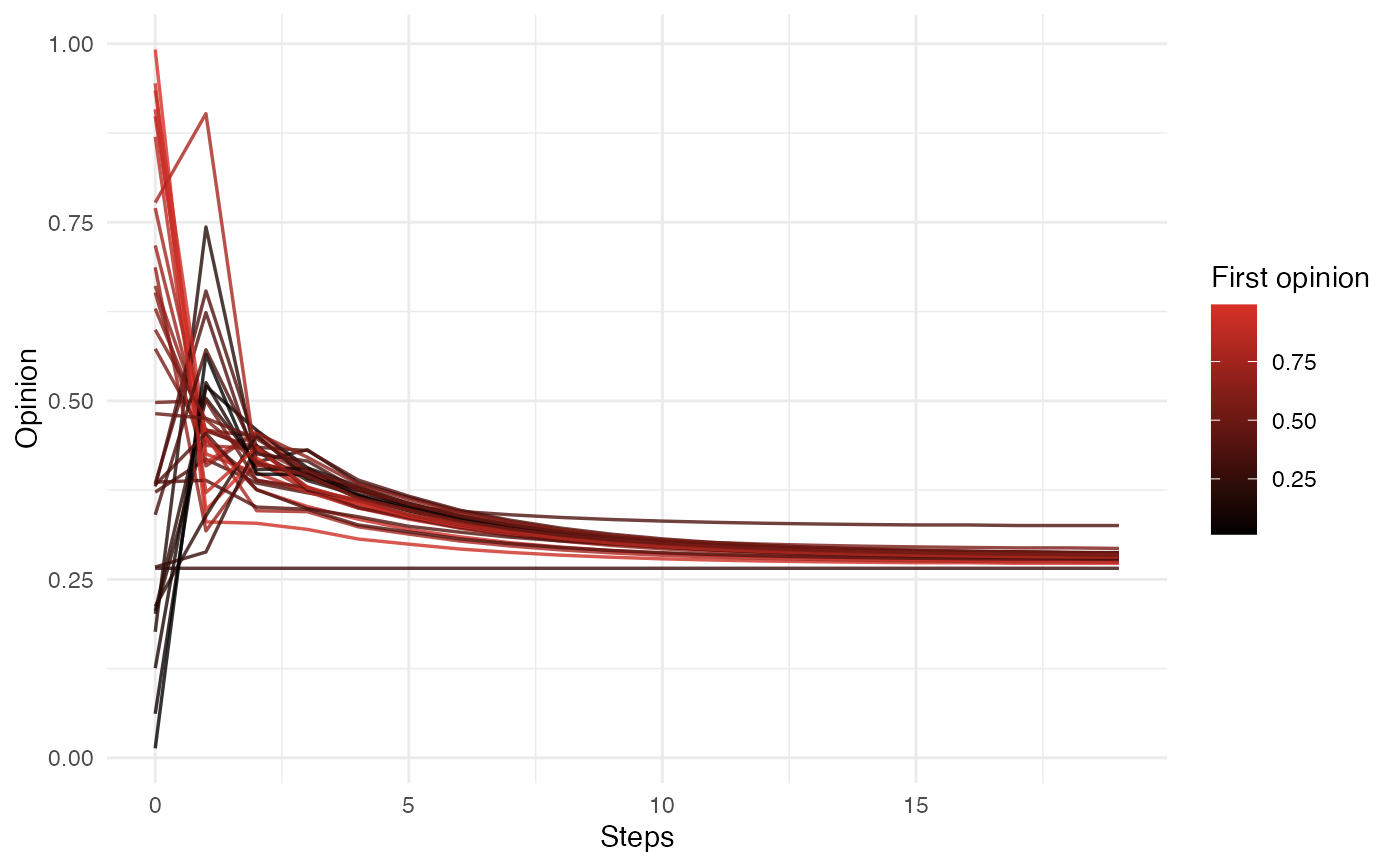
plot.opinionModel() returns a line plot of the opinion of each
node at each step.
plot.opinionSweep() returns a plot of a measure of the opinions
at the end for each setting of a sweep.
Details
plot.opinionModel() draws one line for each node,
from its first opinion at step 0 to its opinion at the last step.
The colour of each line is the first opinion of its node,
on the sequential palette of the theme,
so that the colours meet where the opinions converge.
Where all the nodes end at one opinion, a dashed line marks it.
plot() of a network with a record of opinions,
as from manynet::play_opinion(),
draws the same plot.
It marks the stubborn nodes where the network has a node attribute
named "stubbornness",
as when manynet::play_opinion(stubbornness = "stubbornness") is used.
plot.opinionSweep() draws a measure of the opinions at the end for each
setting of a sweep, as from infernet::sweep_opinion():
by default, the number of opinion clusters.
It draws the settings as plot.diffusionSweep() does:
a bar for each setting, and a panel for each value of any other argument
in vary.
Examples
set.seed(1)
net <- manynet::add_node_attribute(manynet::ison_networkers, "stubbornness",
c(1, 0.5, rep(0, 30)))
opined <- manynet::play_opinion(net, opinions = stats::runif(32),
stubbornness = "stubbornness")
plot(opined)
 plot(manynet::as_opinion(opined))