Plotting diffusion models
Arguments
- x
A "diff_model" of "diffs_model" class of object. E.g. as a result from
manynet::play_diffusion().- ...
Other arguments to be passed.
- all_steps
Whether all steps should be plotted or just those where there is change in the distributions.
Value
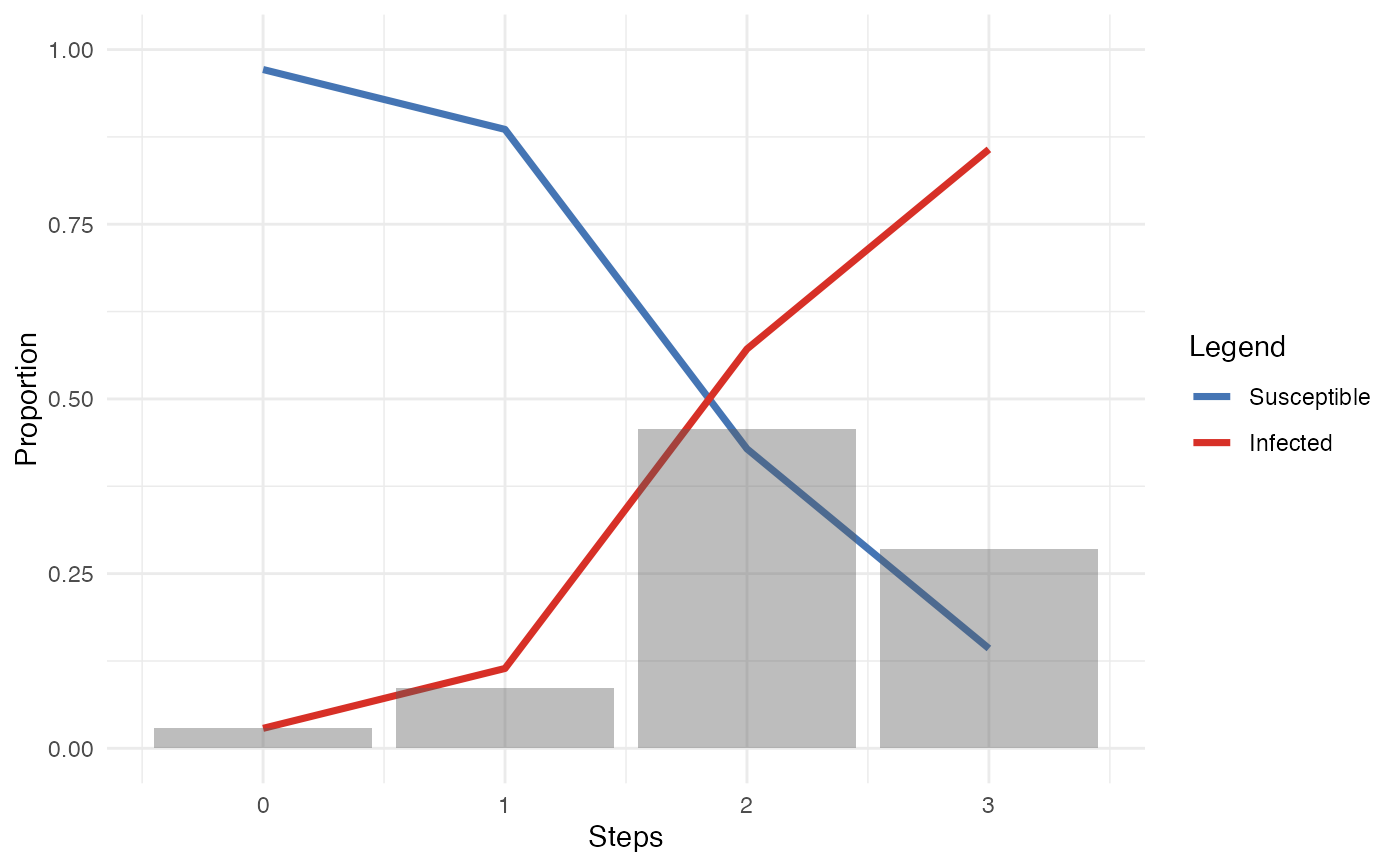
plot.diff_model() returns a bar chart of the number of new
infected nodes at each time point, as well as an overlay line plot of the
total of infected
Examples
plot(res_manynet_diff)
 plot(res_migraph_diff)
#> Warning: pseudoinverse used at -0.015
#> Warning: neighborhood radius 2.015
#> Warning: reciprocal condition number 4.9596e-17
#> Warning: There are other near singularities as well. 4.0602
#> Warning: pseudoinverse used at -0.015
#> Warning: neighborhood radius 2.015
#> Warning: reciprocal condition number 4.9596e-17
#> Warning: There are other near singularities as well. 4.0602
#> Warning: pseudoinverse used at -0.015
#> Warning: neighborhood radius 2.015
#> Warning: reciprocal condition number 4.9596e-17
#> Warning: There are other near singularities as well. 4.0602
#> Warning: pseudoinverse used at -0.015
#> Warning: neighborhood radius 2.015
#> Warning: reciprocal condition number 4.9596e-17
#> Warning: There are other near singularities as well. 4.0602
plot(res_migraph_diff)
#> Warning: pseudoinverse used at -0.015
#> Warning: neighborhood radius 2.015
#> Warning: reciprocal condition number 4.9596e-17
#> Warning: There are other near singularities as well. 4.0602
#> Warning: pseudoinverse used at -0.015
#> Warning: neighborhood radius 2.015
#> Warning: reciprocal condition number 4.9596e-17
#> Warning: There are other near singularities as well. 4.0602
#> Warning: pseudoinverse used at -0.015
#> Warning: neighborhood radius 2.015
#> Warning: reciprocal condition number 4.9596e-17
#> Warning: There are other near singularities as well. 4.0602
#> Warning: pseudoinverse used at -0.015
#> Warning: neighborhood radius 2.015
#> Warning: reciprocal condition number 4.9596e-17
#> Warning: There are other near singularities as well. 4.0602
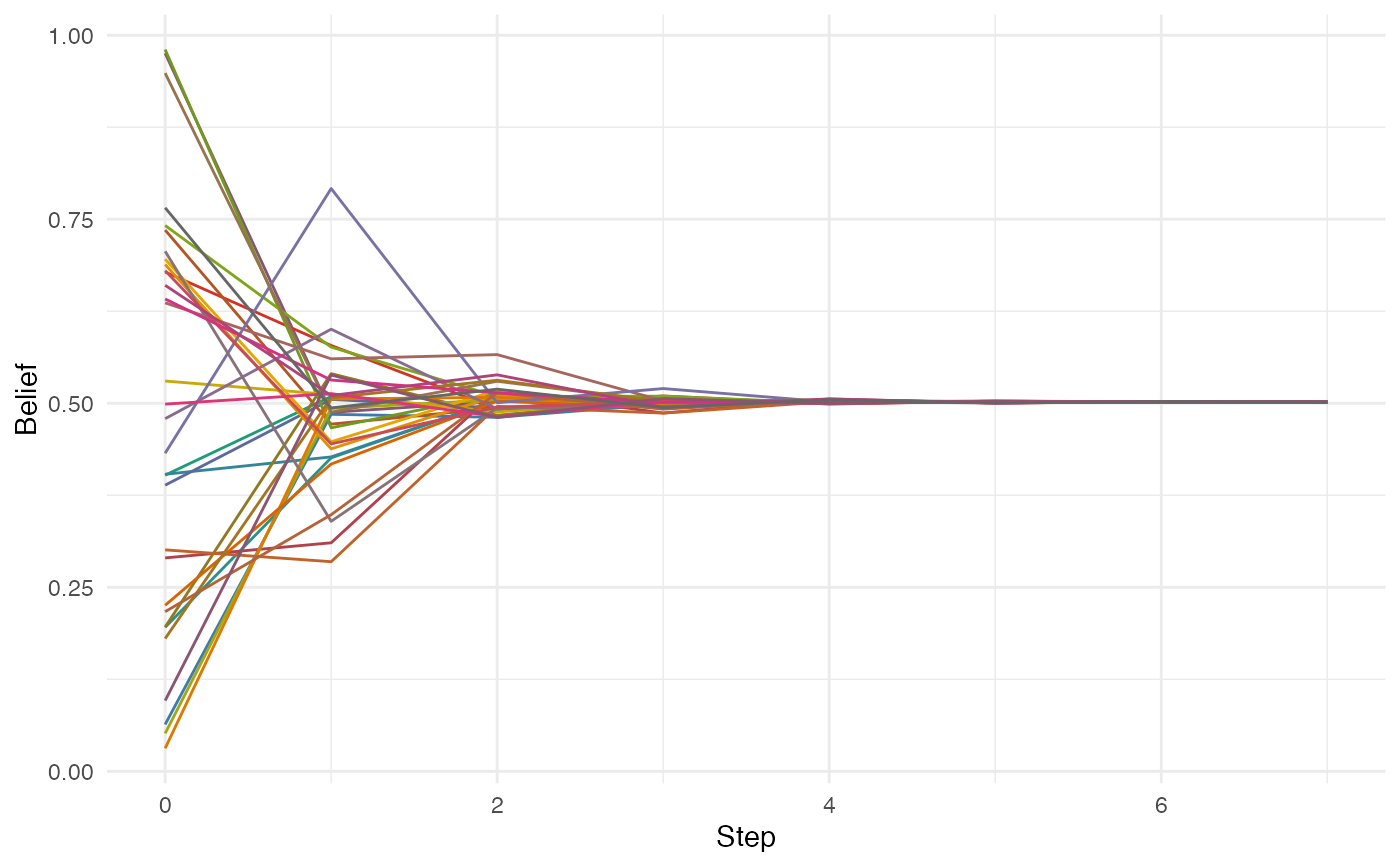
 plot(play_learning(ison_networkers, beliefs = runif(net_nodes(ison_networkers))))