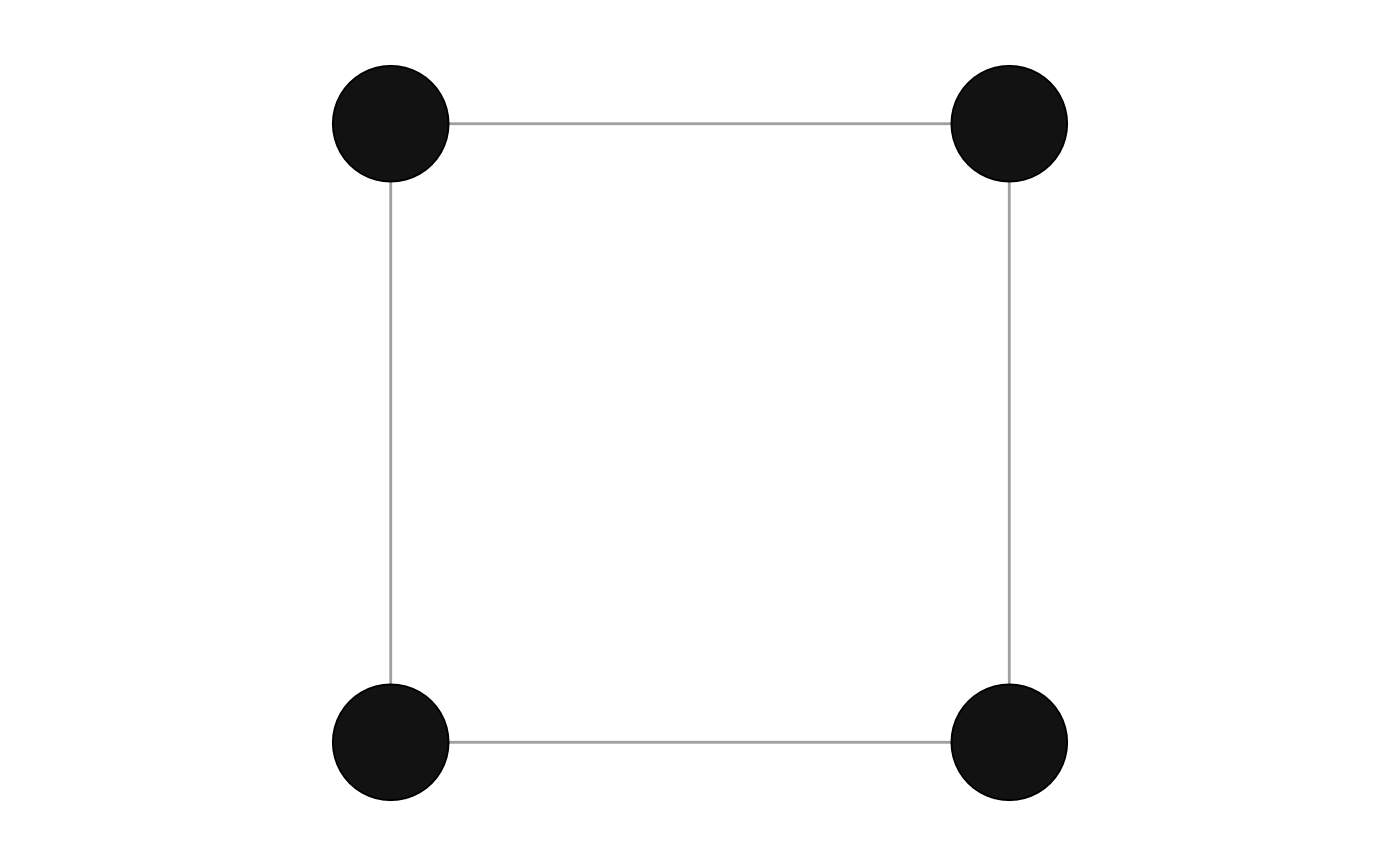
The "spatial" layout places each node at its own position,
as a spatial network records it (see manynet::is_spatial()):
in 'x' and 'y' node attributes,
or in 'lon' and 'lat' (or 'longitude' and 'latitude').
graphr() uses it by default for a spatial network,
such as one read by manynet::read_geojson().
The two axes share one scale, so that a distance drawn is the same
whichever way it runs.
Longitudes and latitudes are drawn on an equirectangular projection centred on the network's mean latitude: each longitude is multiplied by the cosine of that latitude, so that a degree of longitude is drawn as long as it is on the ground there. This keeps the shape of a city or a region, though not of a continent.
A node without a position is placed at the centre of those with one.
Usage
layout_spatial(.data, circular = FALSE, times = 1)

layout_tbl_graph_spatial(.data, circular = FALSE, times = 1)
Arguments
- .data
Some
{manynet}compatible network data.- circular
Should the layout be transformed into a radial representation. Only possible for some layouts. Defaults to FALSE. Required for
{ggraph}compatibility.- times
Maximum number of iterations, where appropriate. Required for
{ggraph}compatibility, and ignored by the layouts that do not iterate.
Examples
net <- manynet::create_ring(4) |>
  manynet::mutate_nodes(x = c(0, 1, 1, 0), y = c(0, 0, 1, 1))
graphr(net)