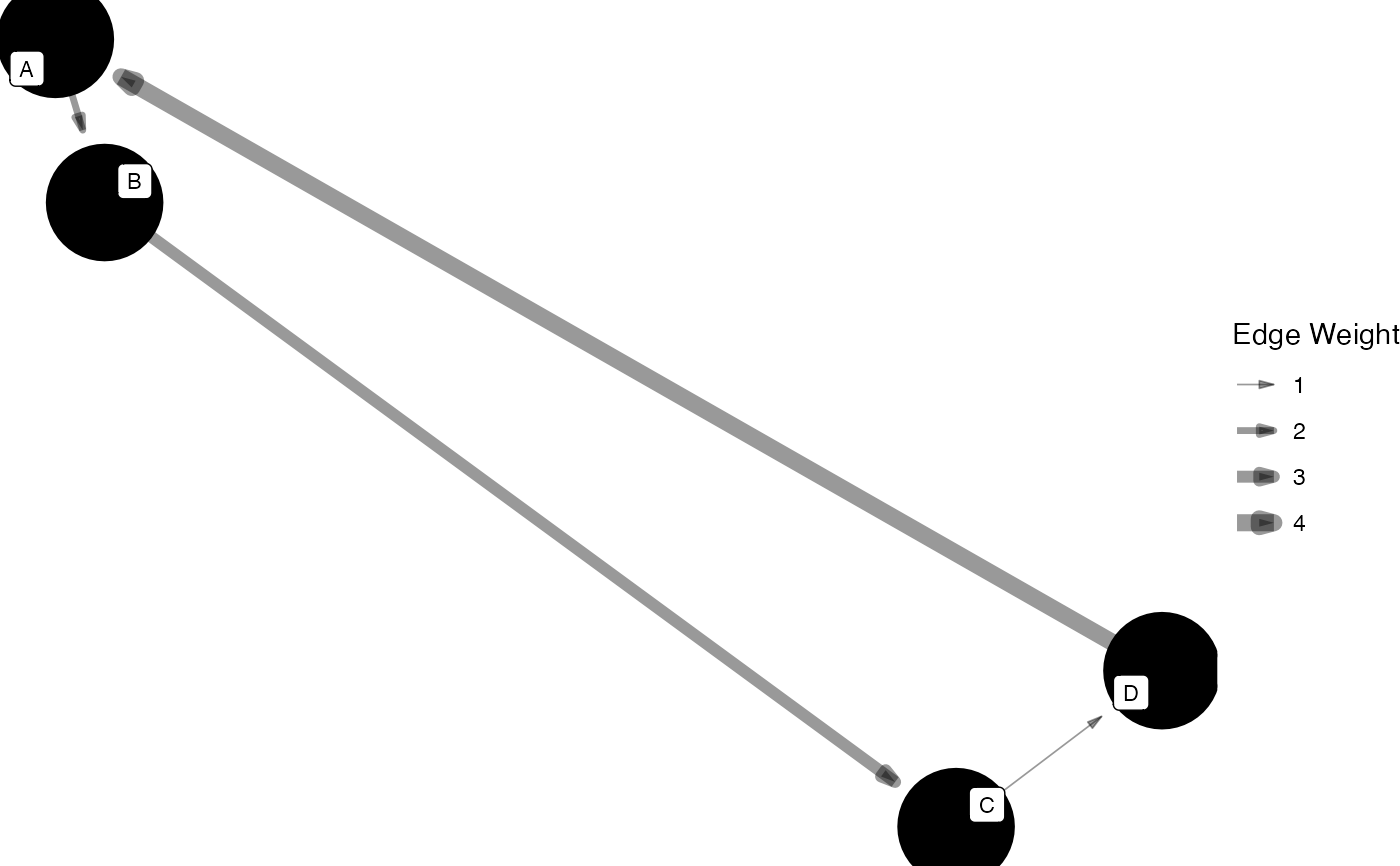
The "valence" layout places the nodes of a signed network so that positively tied nodes are drawn together and negatively tied nodes apart.
Usage
layout_valence(
  .data,
  times = 500,
  center = NULL,
  circular = FALSE,
  repulsion_coef = 1,
  attraction_coef = 0.05
)

layout_tbl_graph_valence(
  .data,
  times = 500,
  center = NULL,
  circular = FALSE,
  repulsion_coef = 1,
  attraction_coef = 0.05
)
Arguments
- .data
Some
{manynet}compatible network data.- times
Maximum number of iterations, where appropriate. Required for
{ggraph}compatibility, and ignored by the layouts that do not iterate.- center
Required for
{ggraph}compatibility, and not used here.- circular
Should the layout be transformed into a radial representation. Only possible for some layouts. Defaults to FALSE. Required for
{ggraph}compatibility.- repulsion_coef
Coefficient for global repulsion force. Default is 1.
- attraction_coef
Coefficient for edge-based attraction/repulsion force. Default is 0.05.