Plotting the transitions of a diffusion
Usage
# S3 method for class 'diffusionTransitions'
plot(x, ..., compartments = NULL)
Arguments
- x
A 'diffusionTransitions' table, as
manynet::play_diffusion()keeps ininfo$transitionsof the network that it returns.- ...
Other arguments to be passed.
- compartments
Optionally, the roles of the values, as a named list such as
list(S = "S", I = "I"), asmanynet::play_diffusion()keeps ininfo$compartments. The roles give the colours of the values. By defaultNULL, which reads the values S, E, I, R, and D as these roles, and otherwise reads the values that a contagion moves nodes from as S, and the values that it comes from as I.
Details
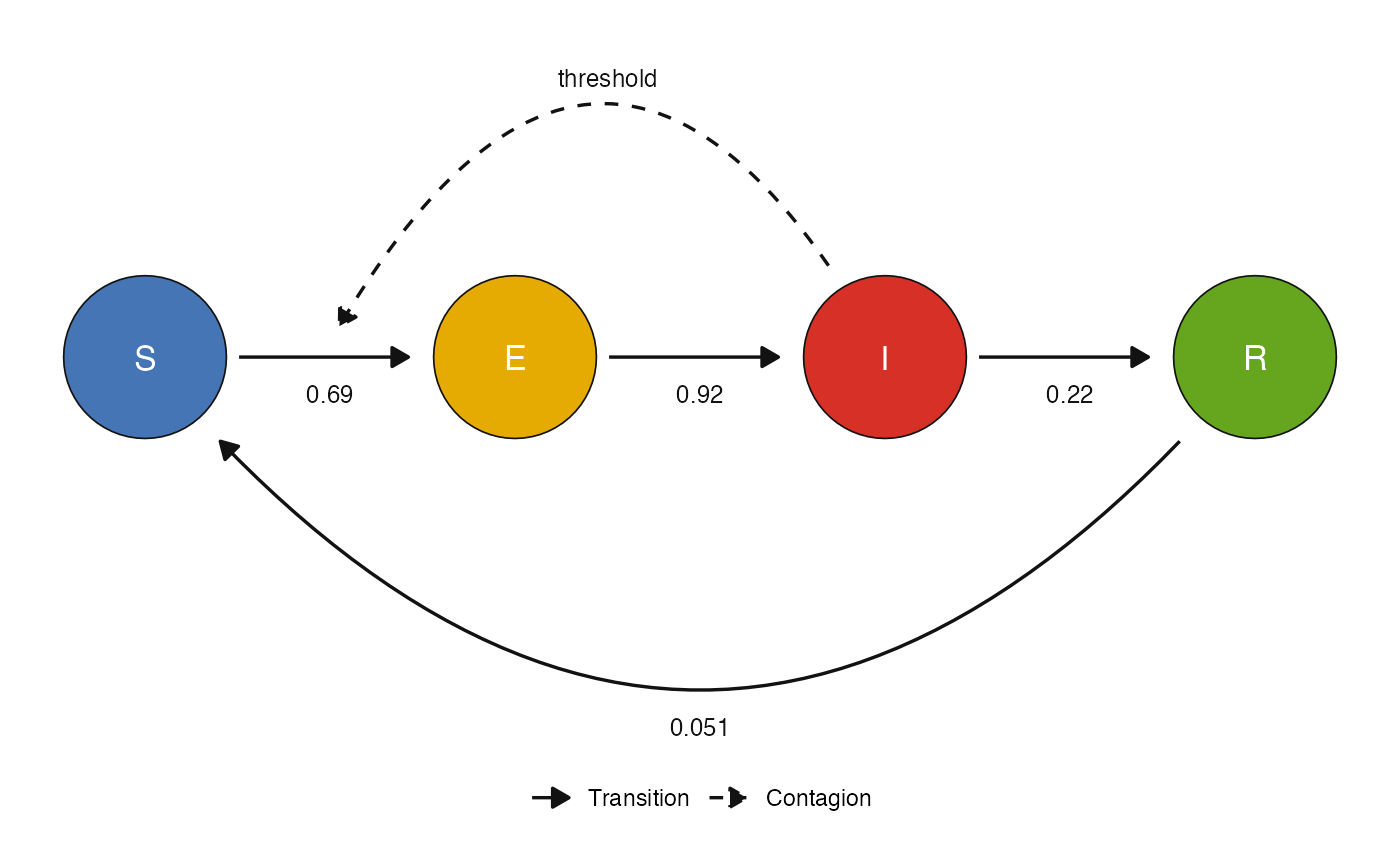
plot.diffusionTransitions() draws the values of the attribute
as circles in a row,
and each transition as an arrow from one value to another,
labelled with its rate.
A transition to the next value in the row is straight,
a transition back is curved under the row,
and a transition that skips a value is curved over it.
A transition by contagion gets a dashed arrow from each value
that it comes from (its source),
labelled with how a node is exposed:
"threshold", "cascade", or "voter".
A rate that differs between nodes is labelled with its range, a rate from a node attribute with the name of the attribute, and a rate from a function with "f(x)".
Examples
set.seed(1)
net <- manynet::play_diffusion(manynet::ison_adolescents, seeds = 1,
  transmissibility = 0.5, onset = 0.6, recovery = 0.2, waning = 0.05)
plot(net$info$transitions)