Plotting mobility models
Usage
# S3 method for class 'mobilityModel'
plot(x, ...)
Arguments
- x
A 'mobilityModel', as from
manynet::as_mobility().- ...
Other arguments to be passed.
Value
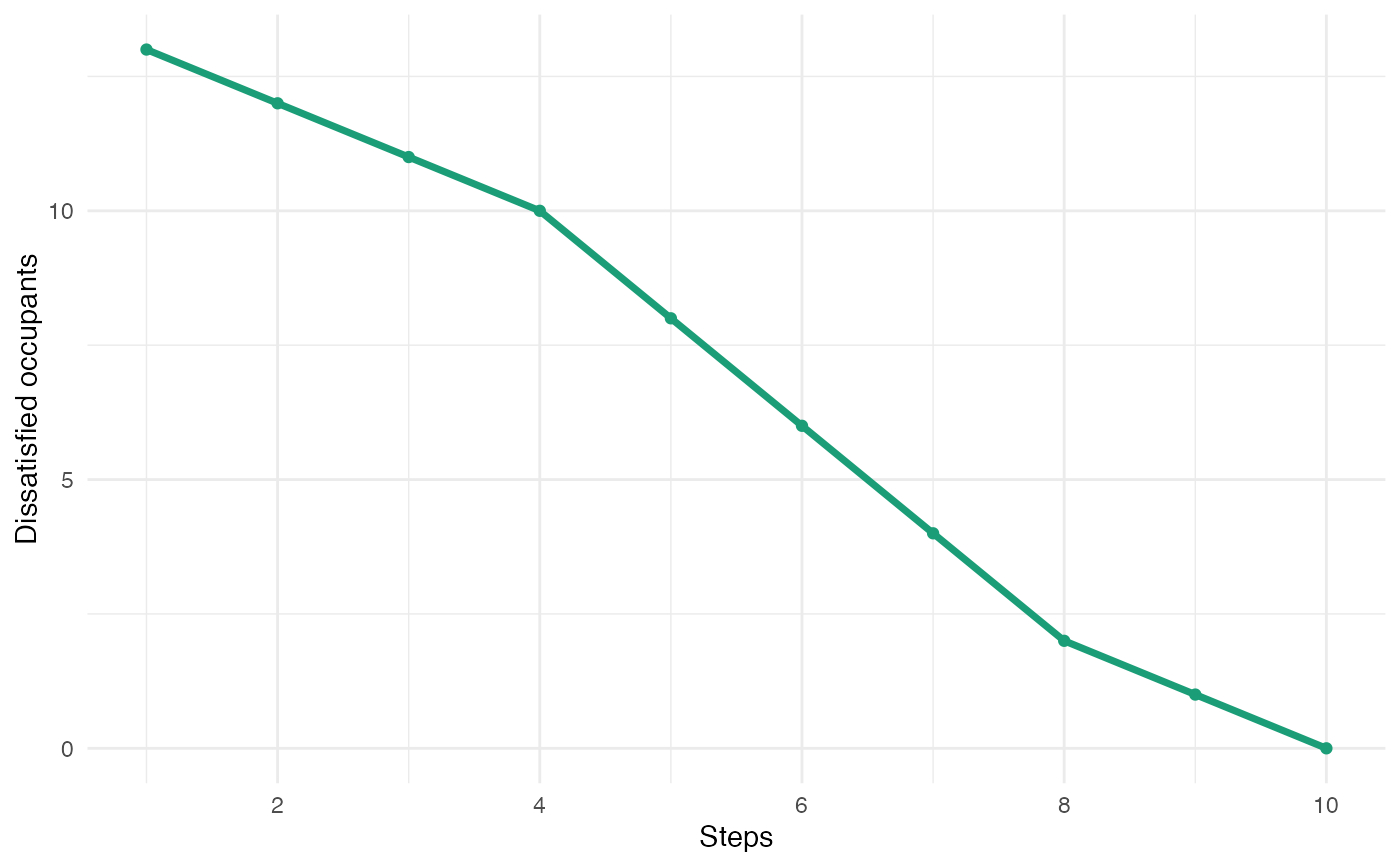
plot.mobilityModel() returns a line plot of the number of
dissatisfied occupants at each step.
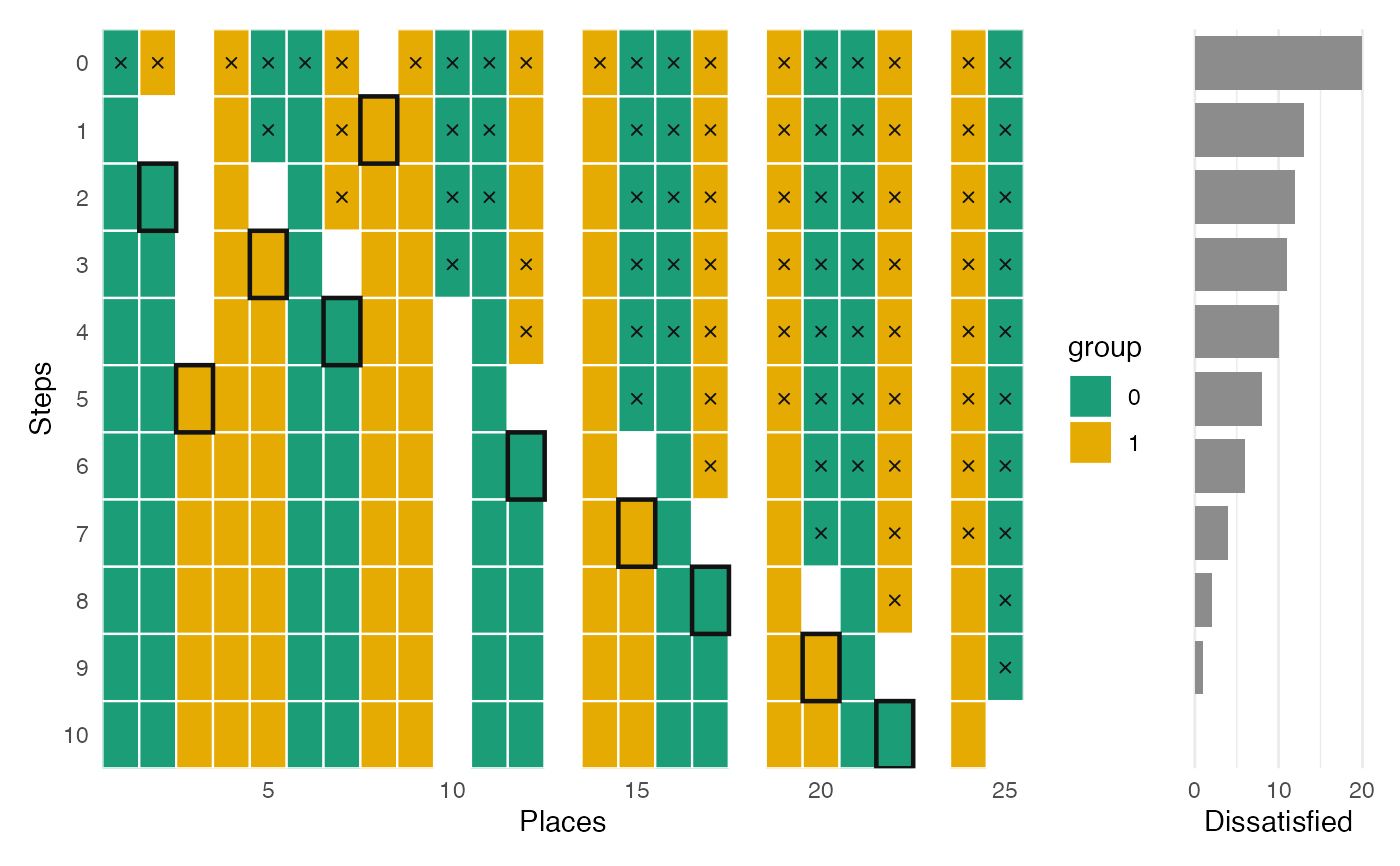
plot() of a network of places returns a grid of the occupants of the
places at each step, with a bar plot of the dissatisfied occupants.
Details
plot.mobilityModel() draws the number of dissatisfied occupants
after each move.
A 'mobilityModel' alone does not hold the start,
so its line begins at the first move.
plot() of a network of places with a record of moves,
as from manynet::play_mobility(), draws more:
a grid with a row for each step, from the start at step 0,
and a column for each place.
Each tile is filled by the attribute of its occupant,
and an empty place is left blank.
A cross marks a dissatisfied occupant,
and an outline marks the place that an occupant moved to at that step.
In the margin, a bar gives the number of dissatisfied occupants
at each step.
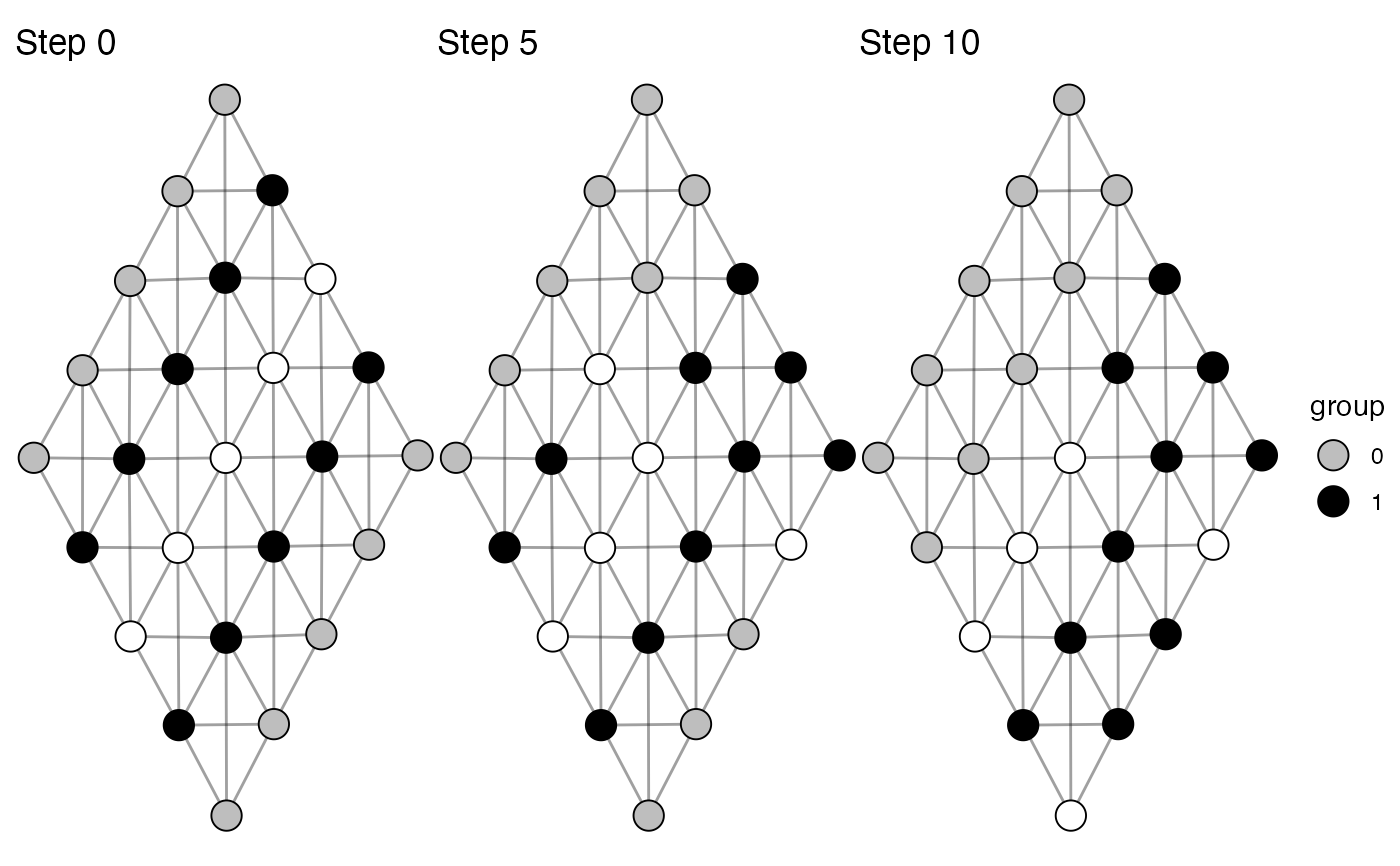
To draw the places at the start, the middle, and the last move,
use graphs() on the network of places.
Examples
places <- manynet::add_node_attribute(manynet::create_lattice(25), "group",
rep(c(0, 1, NA, 1, 0), 5))
moved <- manynet::play_mobility(places, "group")
plot(moved)
 plot(manynet::as_mobility(moved))
 graphs(moved)