R/plot_monan.R
plot_monan_trace.Rd
plot.traces.monan
# S3 method for class 'traces.monan'
plot(x, ...)
An object of class "traces.monan".
Additional plotting parameters, use not recommended.
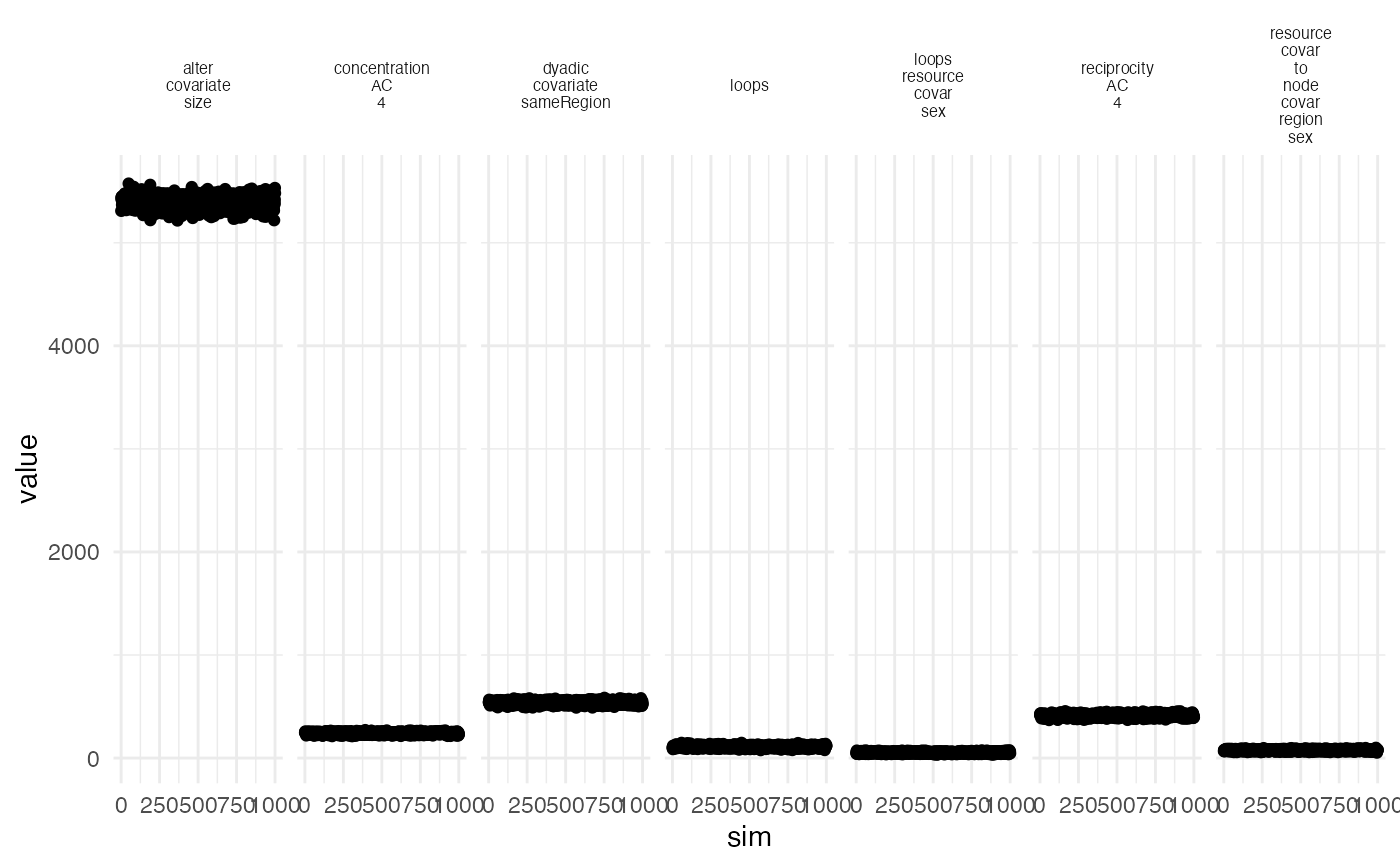
The function plot.traces.monan shows a scatter plot of the statistics of simulated networks from phase three of the esimtation.
plot(res_monan_traces)