plot.gof.stats.monan
Usage
# S3 method for class 'gof.stats.monan'
plot(x, lvls, ...)Value
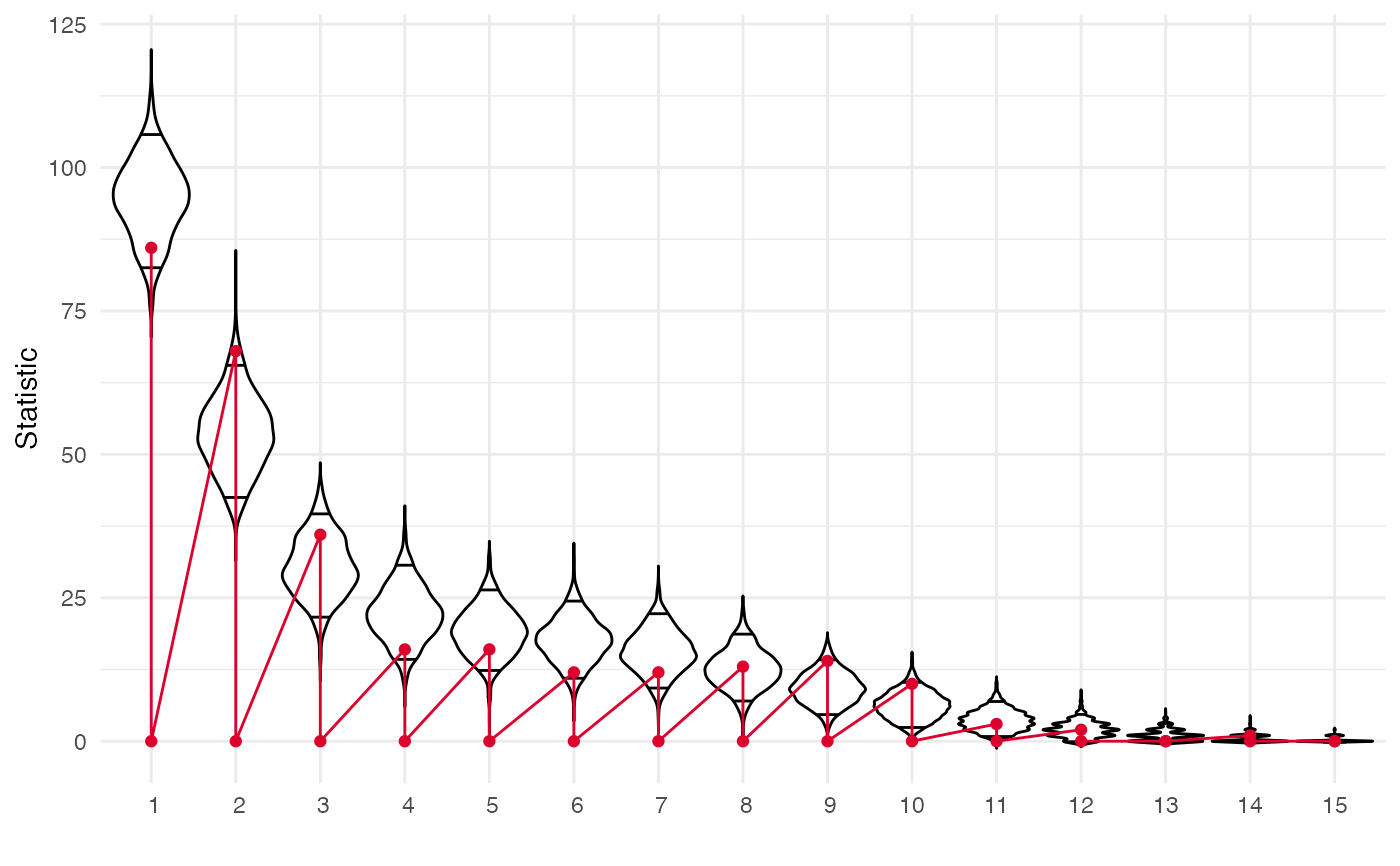
The function plot.gof.stats.monan returns violin plots of the
gof tests with observed values superimposed in red.
Examples
plot(res_monan_gof, lvls = 1:15)
#> Warning: The `x` argument of `as_tibble.matrix()` must have unique column names if
#> `.name_repair` is omitted as of tibble 2.0.0.
#> ℹ Using compatibility `.name_repair`.
#> ℹ The deprecated feature was likely used in the autograph package.
#>   Please report the issue at <https://github.com/stocnet/autograph/issues>.