This function plots goodness of fit objects created using RSiena.
Unlike the plot method included in the {RSiena} package,
this function utilises {ggplot2} and not {lattice},
which makes the output more compatible and themeable.
Usage
# S3 method for class 'sienaGOF'
plot(x, ...)
Arguments
- x
A sienaGOF object, as returned by
RSiena::sienaGOF().- ...
Other parameters to be passed to the plotting funciton, for example
main = "Title"for a different title than the default.
Value
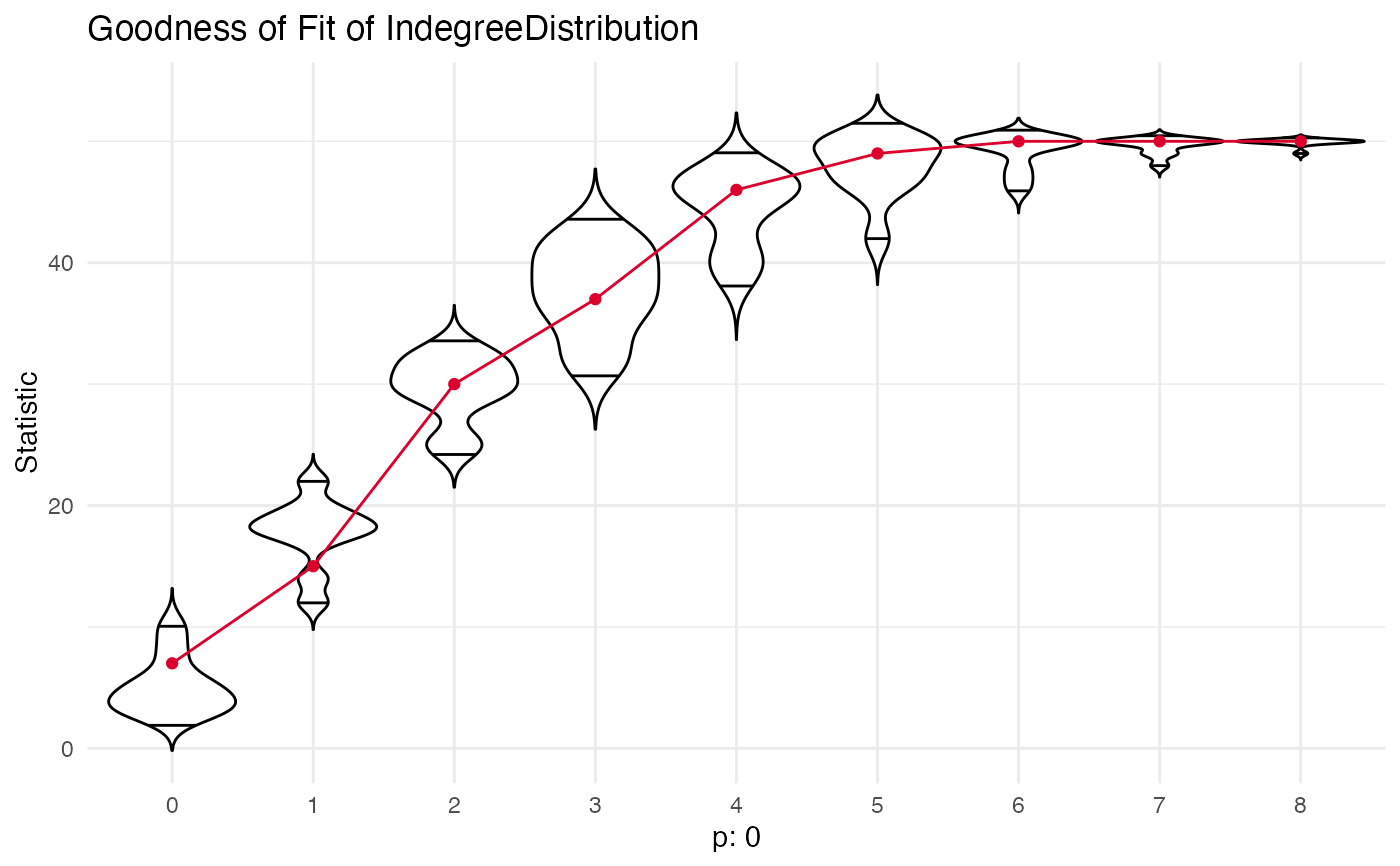
A violin plot showing the distribution of statistics from the simulations and a line highlighting the observed statistics.
Examples
plot(res_siena_gof)