These are functions for constructing and presenting influence tables for the interpretation of results for network and behavior dynamics obtained with the RSiena or multiSiena packages.
Usage
# S3 method for class 'influenceTable'
plot(x, separation = 0, ...)
Arguments
- x
An object of class "influenceTable", created using
RSiena::influenceTable().- separation
This can be used to make the curves visually distinguishable if they overlap too much without it. An advisable value then is, e.g., 0.01.
- ...
Other arguments to be passed.
Value
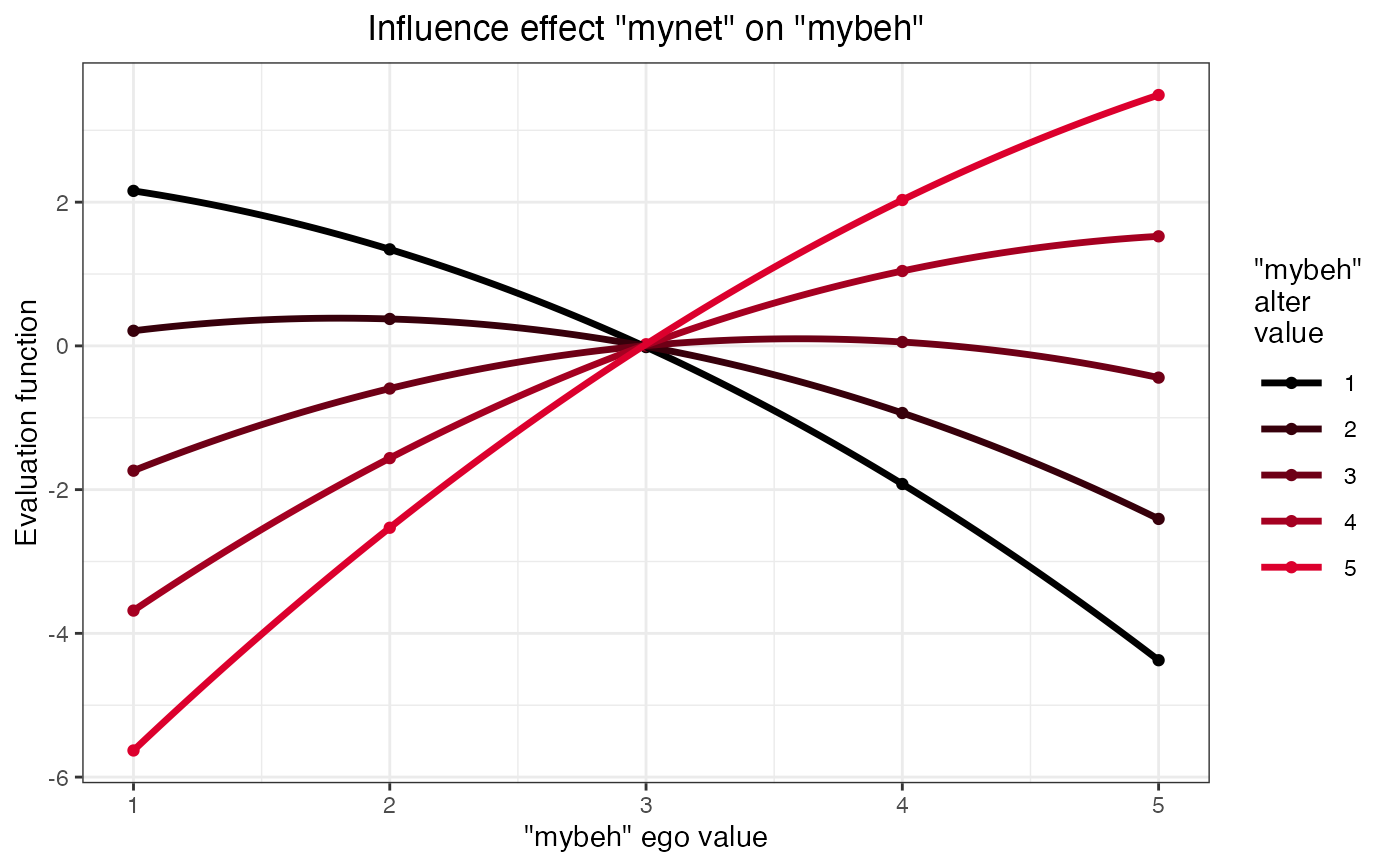
A plot showing how the influence evaluation function changes based on ego's value and alter's value of some covariate.
References
Consult also the RSiena manual, Sections 13.2 and 13.4. Gratitude to Steffen Triebel and Rene Veenstra for corrections.
Examples
plot(res_siena_influence)