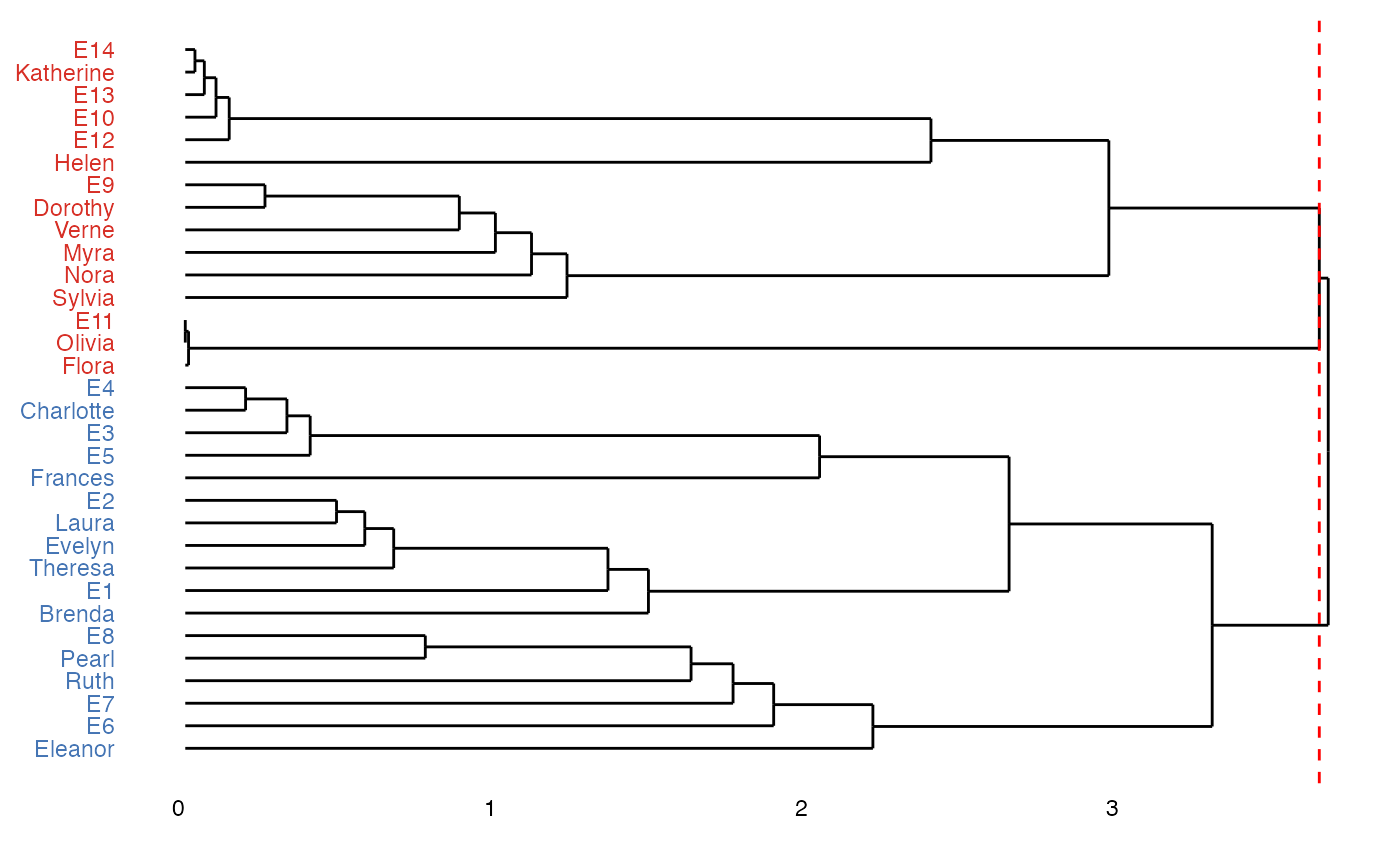
This plotting method operates on "node_member" class objects from the
{manynet} package, plotting the dendrogram of their membership.
Value
plot.node_member() returns a dendrogram, with labels colored to
indicate the different clusters, and with the optimal cutpoint shown by a
dashed highlight line.
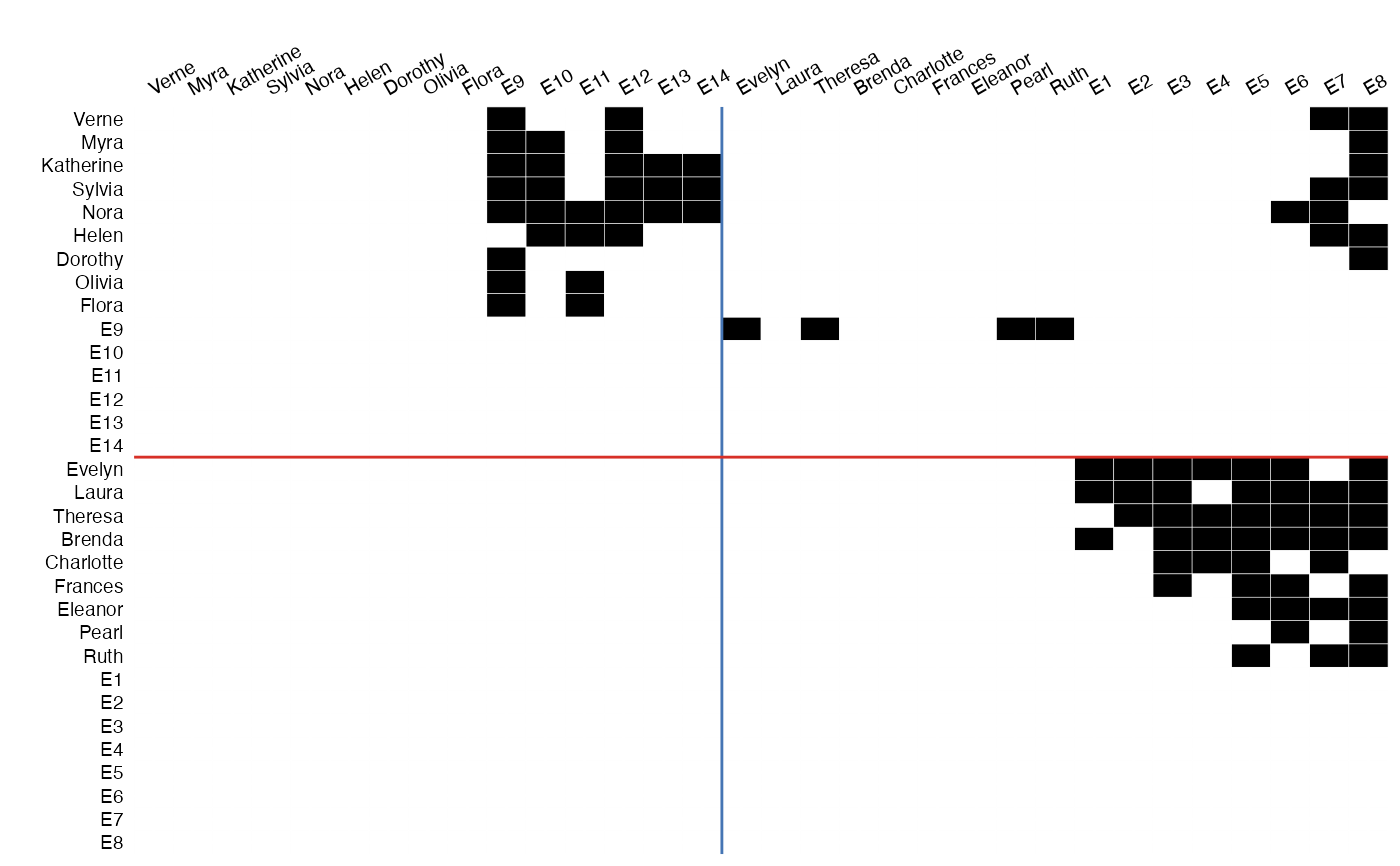
plot.matrix() returns a plot of an adjacency or incidency matrix,
potentially with the rows and columns reordered to illustrate an additional
membership vector.
Examples
plot(netrics::node_in_walktrap(ison_southern_women, "e"))
 plot(as_matrix(ison_adolescents),
membership = netrics::node_in_walktrap(ison_adolescents, "e"))
plot(as_matrix(ison_adolescents),
membership = netrics::node_in_walktrap(ison_adolescents, "e"))
 plot(as_matrix(ison_southern_women),
membership = netrics::node_in_walktrap(ison_southern_women, "e"))
plot(as_matrix(ison_southern_women),
membership = netrics::node_in_walktrap(ison_southern_women, "e"))