These functions plot distributions for node, tie, and network measures,
as defined in the {manynet} package.
Value
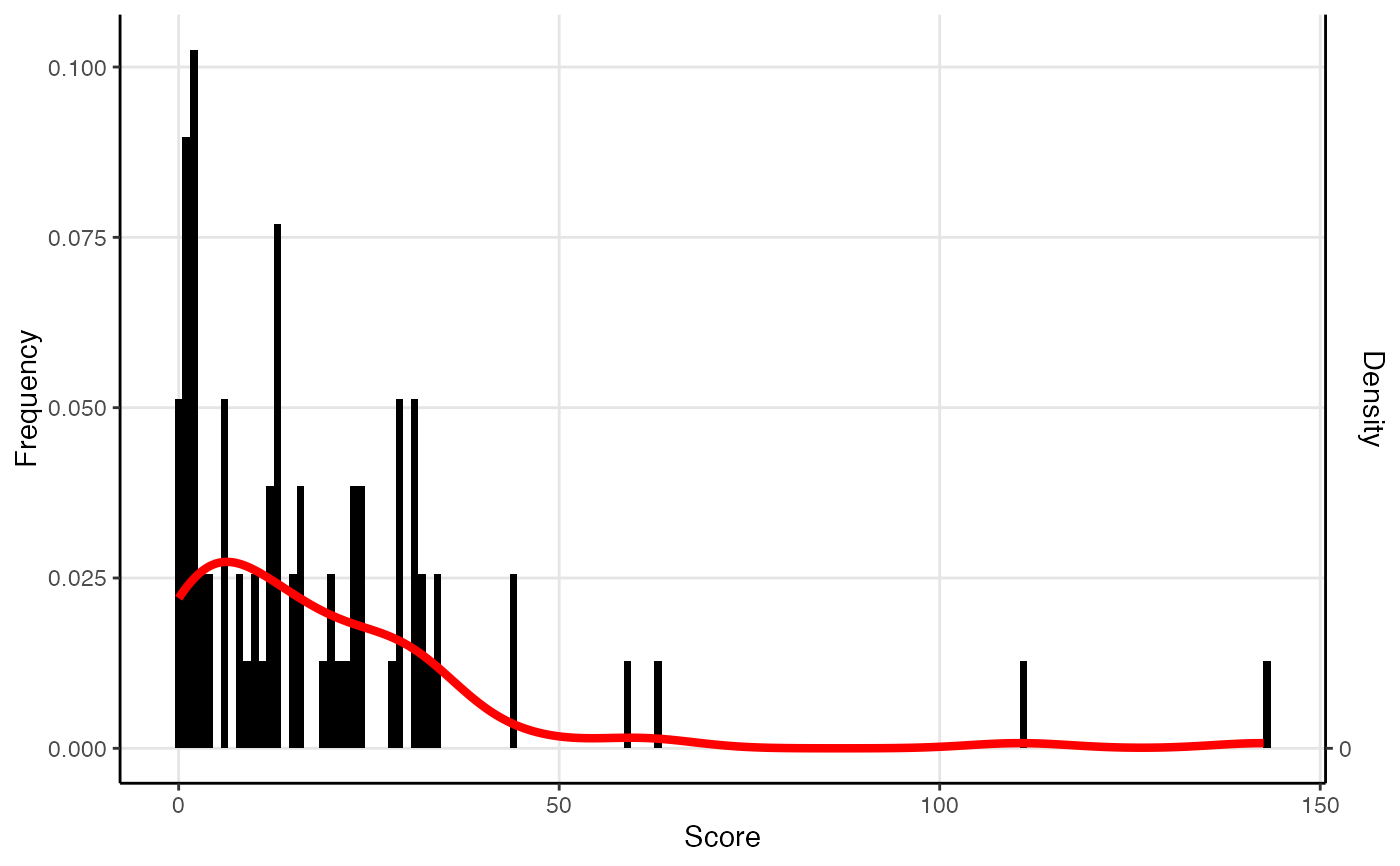
plot.node_measure() and plot.tie_measure() returns a histogram
and/or density plot of the distribution of the measure.
plot.network_measures() returns a plot of the measure traced over
time.
Examples
plot(netrics::node_by_deg(ison_karateka))
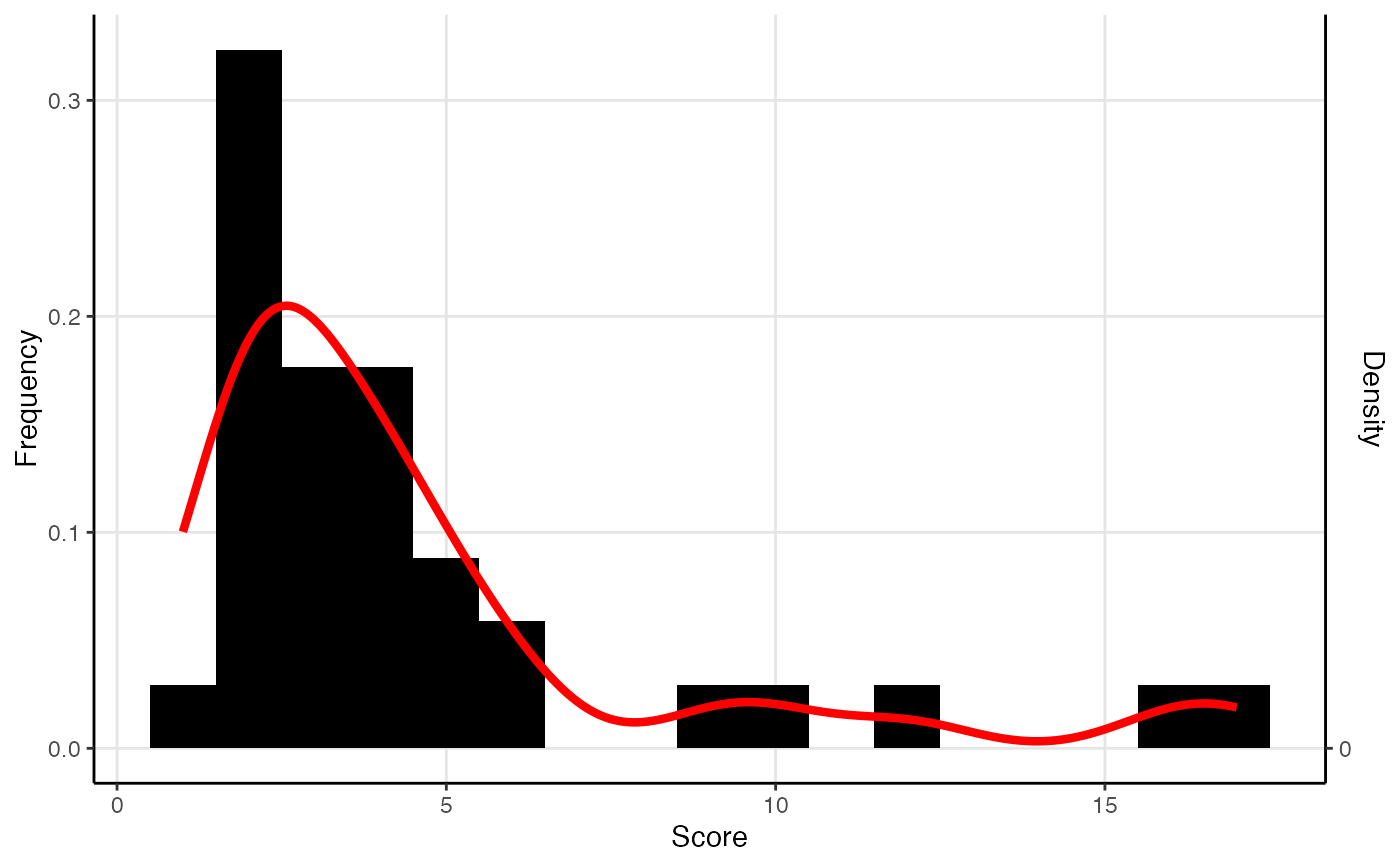 plot(netrics::tie_by_betweenness(ison_karateka))